Open Access
Fig. 3.
Download original image
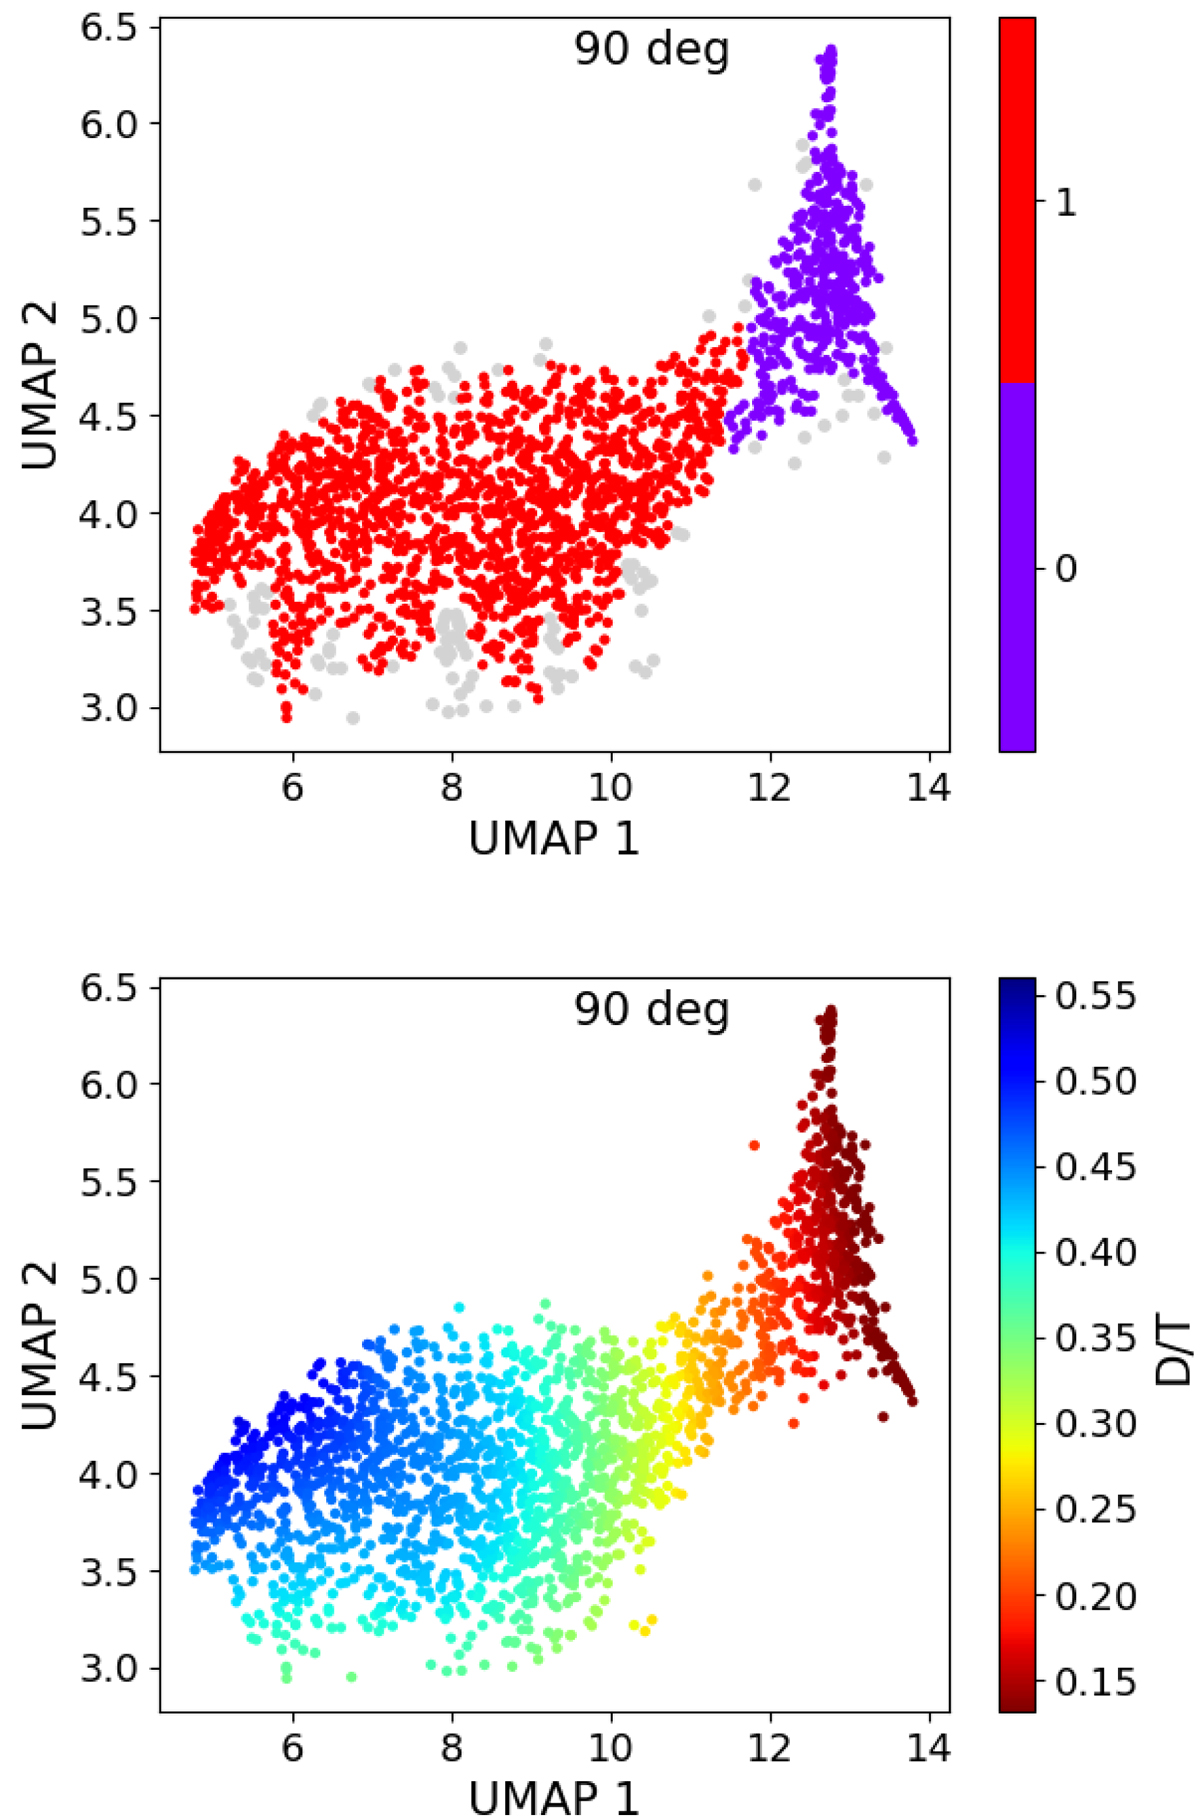
Results of UMSCANGALACTIK applied to the line-of-sight velocity maps in which every galaxy has the same rotation direction. Top panel: HDBSCAN clusters in the UMAP bidimensional projection. The outliers of the method are shown as grey dots. Bottom panel: Distribution of D/T on the projection.
Current usage metrics show cumulative count of Article Views (full-text article views including HTML views, PDF and ePub downloads, according to the available data) and Abstracts Views on Vision4Press platform.
Data correspond to usage on the plateform after 2015. The current usage metrics is available 48-96 hours after online publication and is updated daily on week days.
Initial download of the metrics may take a while.