Open Access
Fig. B.1.
Download original image
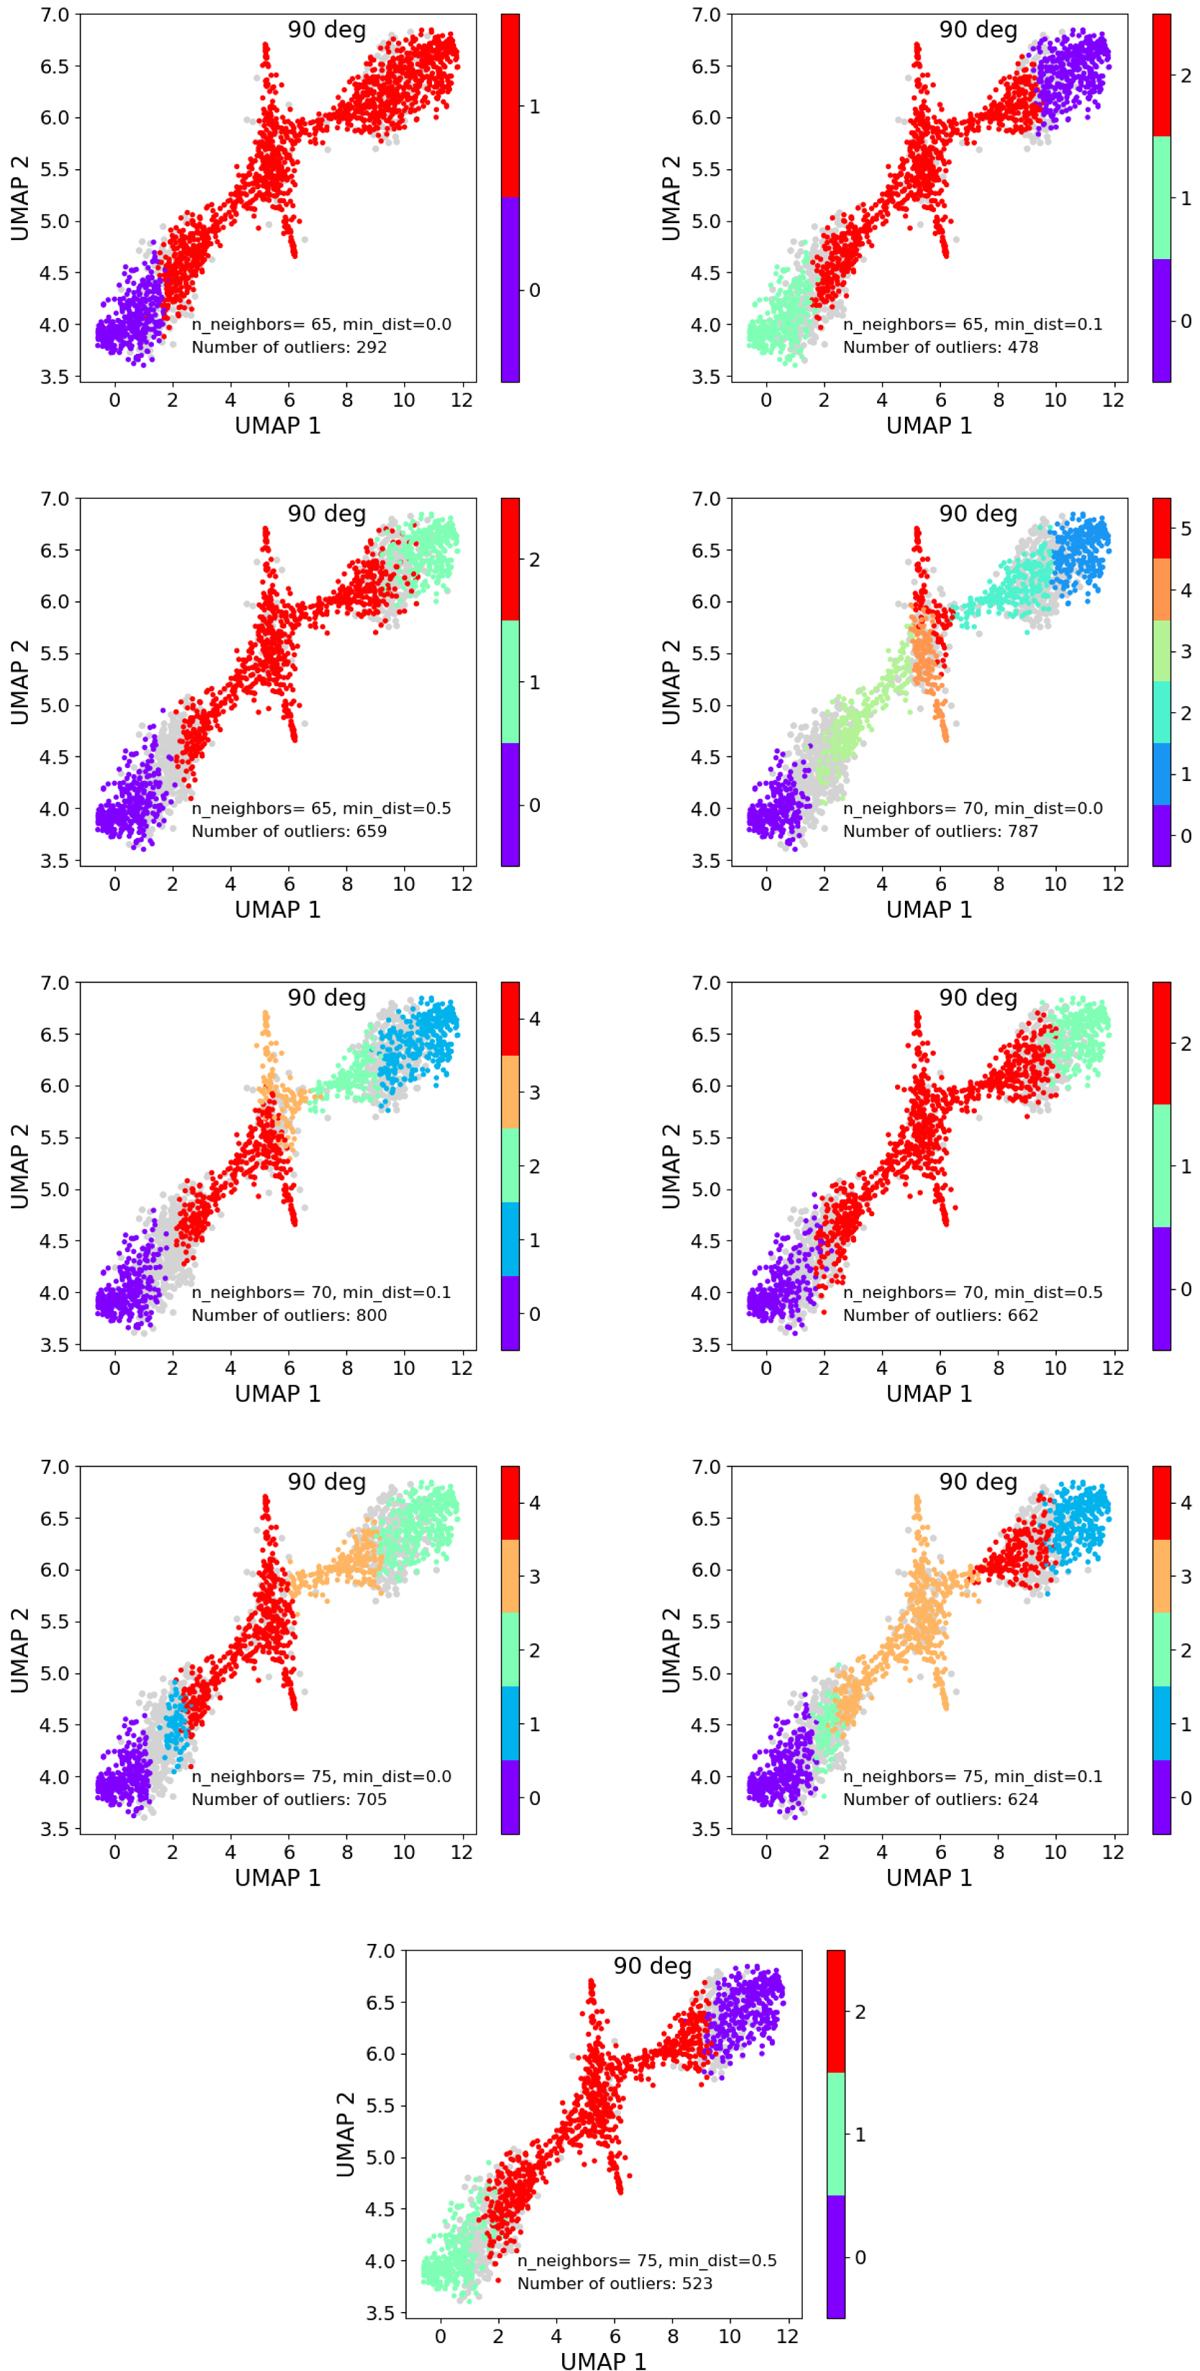
Bidimensional UMAP projection colour-coded according to HDBSCAN clustering applied to a ten-dimensional UMAP embdedding for the set of line-of-sight velocity maps of edge-on galaxies (Sect. 4.1). The outliers are shown as grey dots. Also included are the values of n_neighbors and min_dist, as well as the number of outliers.
Current usage metrics show cumulative count of Article Views (full-text article views including HTML views, PDF and ePub downloads, according to the available data) and Abstracts Views on Vision4Press platform.
Data correspond to usage on the plateform after 2015. The current usage metrics is available 48-96 hours after online publication and is updated daily on week days.
Initial download of the metrics may take a while.