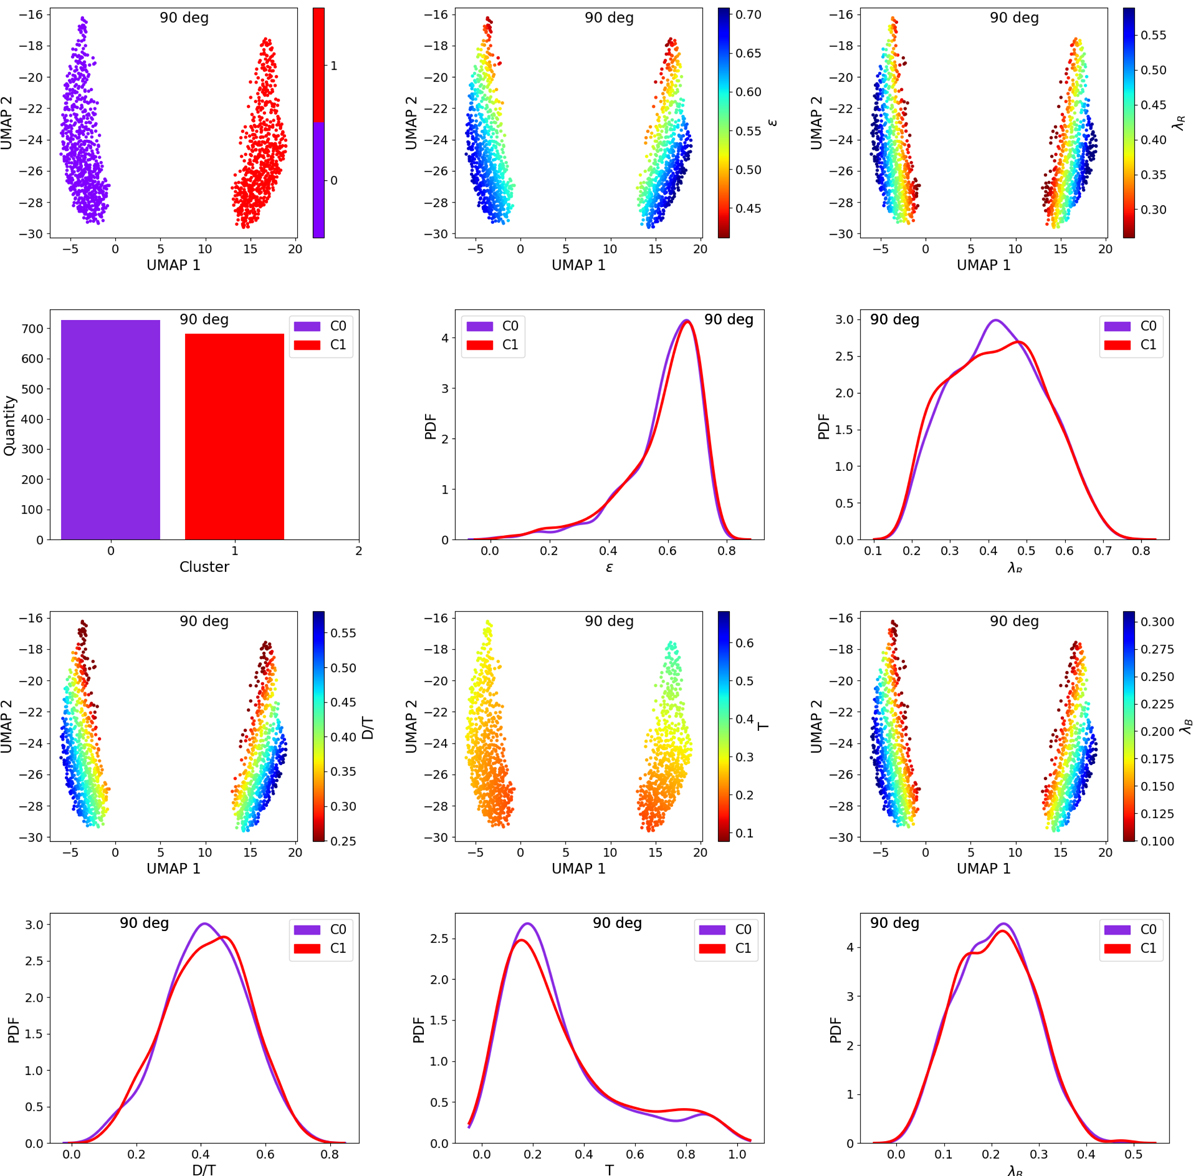
Fig. 11.
Download original image
Results of UMSCANGALACTIK applied to all the kinematic map types of galaxies with λR, edge − on > 0.2 observed at 90 degrees. Top row: HDBSCAN clusters in the UMAP bidimensional projection (left panel), and distributions of the projected parameters ε (middle panel) and λR (right panel) on the projection. Second row: Size of the clusters (left panel), and PDFs of ε (middle panel) and λR (right panel) for each cluster. Third row: Distributions of three-dimensional parameters D/T (left panel), T (middle panel), and λB (right panel) on the projection. Bottom row: PDFs of D/T (left panel), T (middle panel), and λB (right panel) for each cluster. The colour bar limits are fixed to the 10th and 90th percentiles of the variables.
Current usage metrics show cumulative count of Article Views (full-text article views including HTML views, PDF and ePub downloads, according to the available data) and Abstracts Views on Vision4Press platform.
Data correspond to usage on the plateform after 2015. The current usage metrics is available 48-96 hours after online publication and is updated daily on week days.
Initial download of the metrics may take a while.