Fig. 4
Download original image
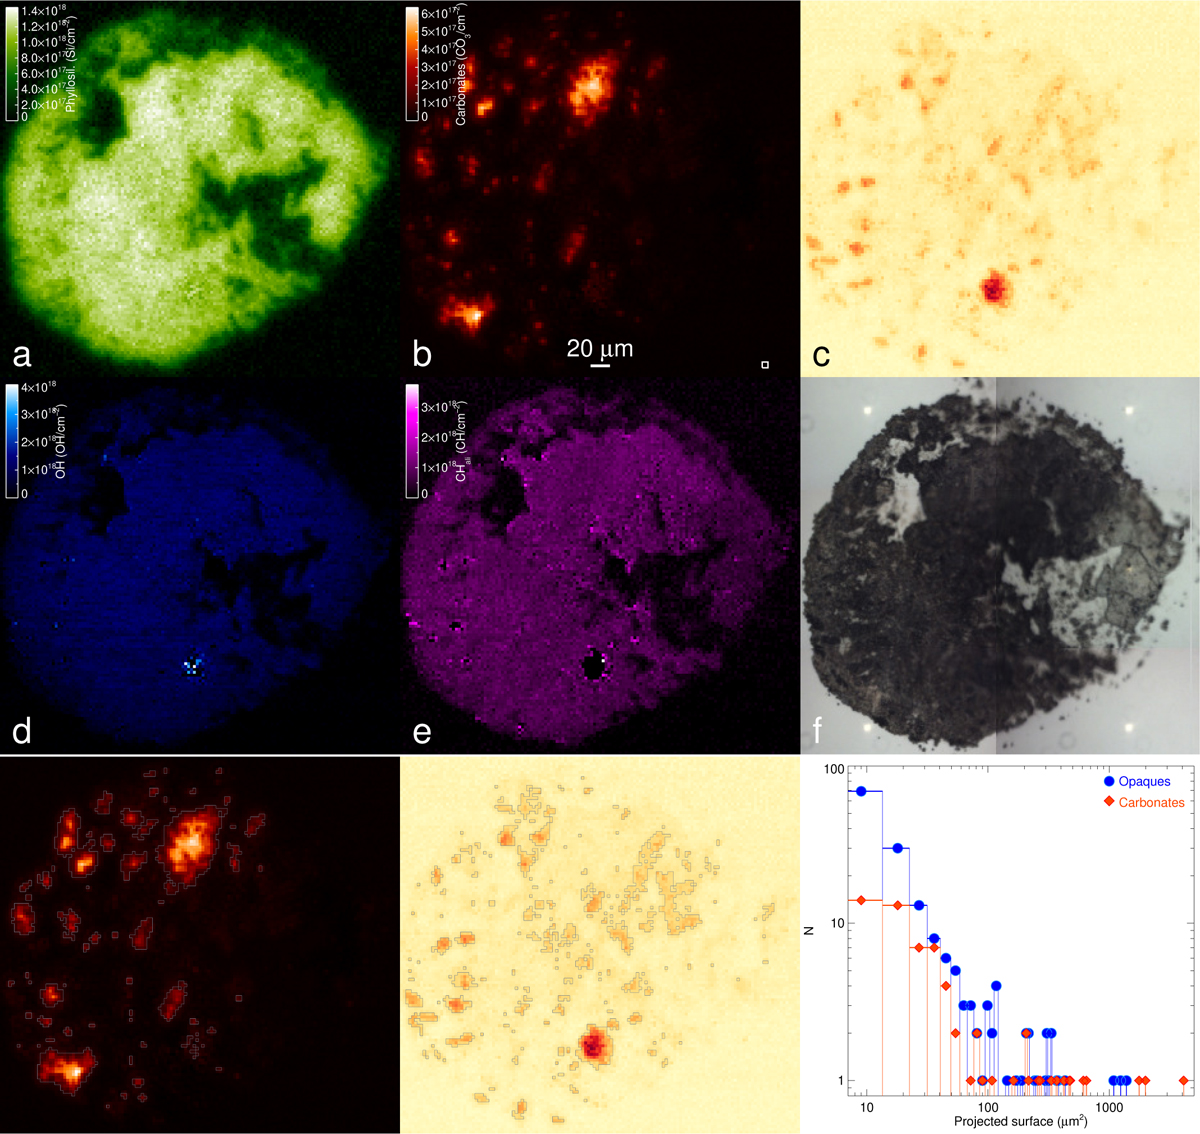
Chamber C Ryugu sample C0040-FC025 (bottom diamond window). Phase maps of silicates (a, green), carbonates (b, red), opaques (c, yellow-orange), OH stretch (d, blue), CH stretch (e, magenta), and corresponding visible images (f). Bottom: images representing the edge detection of individual ROIs based on the intensity map of carbonates (left), and of opaques (middle), and resulting size distribution histograms (right). The x-axis represents the projected surface of each region in μm2 (multiples of the spatial resolution of 9 μm2). As the samples are flattened to ~1 μm, this projected surface is directly proportional to the same volume value.
Current usage metrics show cumulative count of Article Views (full-text article views including HTML views, PDF and ePub downloads, according to the available data) and Abstracts Views on Vision4Press platform.
Data correspond to usage on the plateform after 2015. The current usage metrics is available 48-96 hours after online publication and is updated daily on week days.
Initial download of the metrics may take a while.