Fig. 3
Download original image
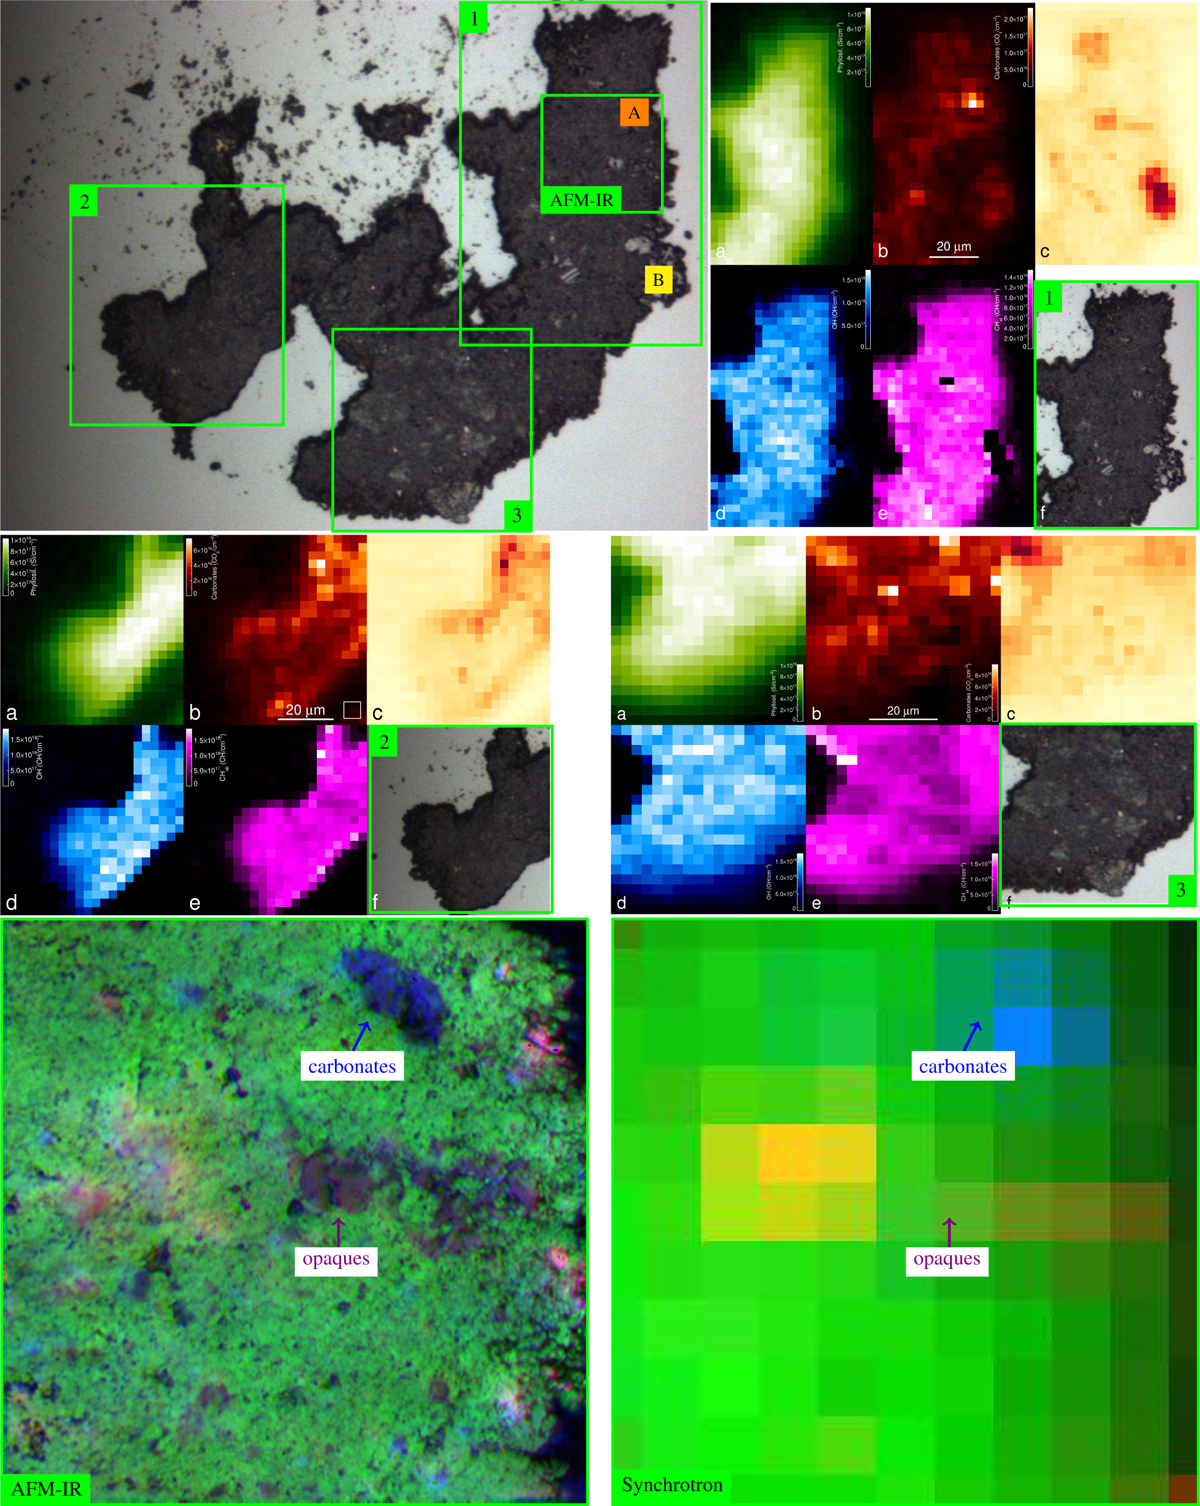
Chamber A Ryugu sample #A0108-15 (03) (top diamond window). Upper left: Visible image recording the entire flattened grain with an extent of about 150 μm. The positions A and B correspond to the individual spectra shown in Fig. 1, showing a carbonate-rich region (A) and a region with inorganic opaques (probably magnetite and/or Fe sulphides) (B). The regions of interest mapped with the synchrotron measurements are numbered from 1 to 3. Top right and middle panel sets: Coloured phase maps for regions 1 to 3 corresponding, for each map, to silicates (a, green), carbonates (b, red), opaques, (c, yellow-orange), OH stretch (d, blue), CH stretch (e, magenta), and respective visible image (f). It should be noted that a few outlier (white) points with apparent high optical depth may be observed in the OH and CH stretch maps. They coincide with the presence of opaques or are on maps' borders. They are due to low signal-to-noise ratios, which lead to a higher uncertainty on the baseline determination (and correction). Lower panel: Images representing the same region mapped by AFM-IR (left, composite map of 30 μm × 30 μm, green, silicates; blue, carbonates; red, opaques), and mapped with synchrotron at the highest achievable spatial resolution (right,~6 μm aperture with a step size of ~3 μm, i.e. close to Nyquist sampling).
Current usage metrics show cumulative count of Article Views (full-text article views including HTML views, PDF and ePub downloads, according to the available data) and Abstracts Views on Vision4Press platform.
Data correspond to usage on the plateform after 2015. The current usage metrics is available 48-96 hours after online publication and is updated daily on week days.
Initial download of the metrics may take a while.