Fig. 2
Download original image
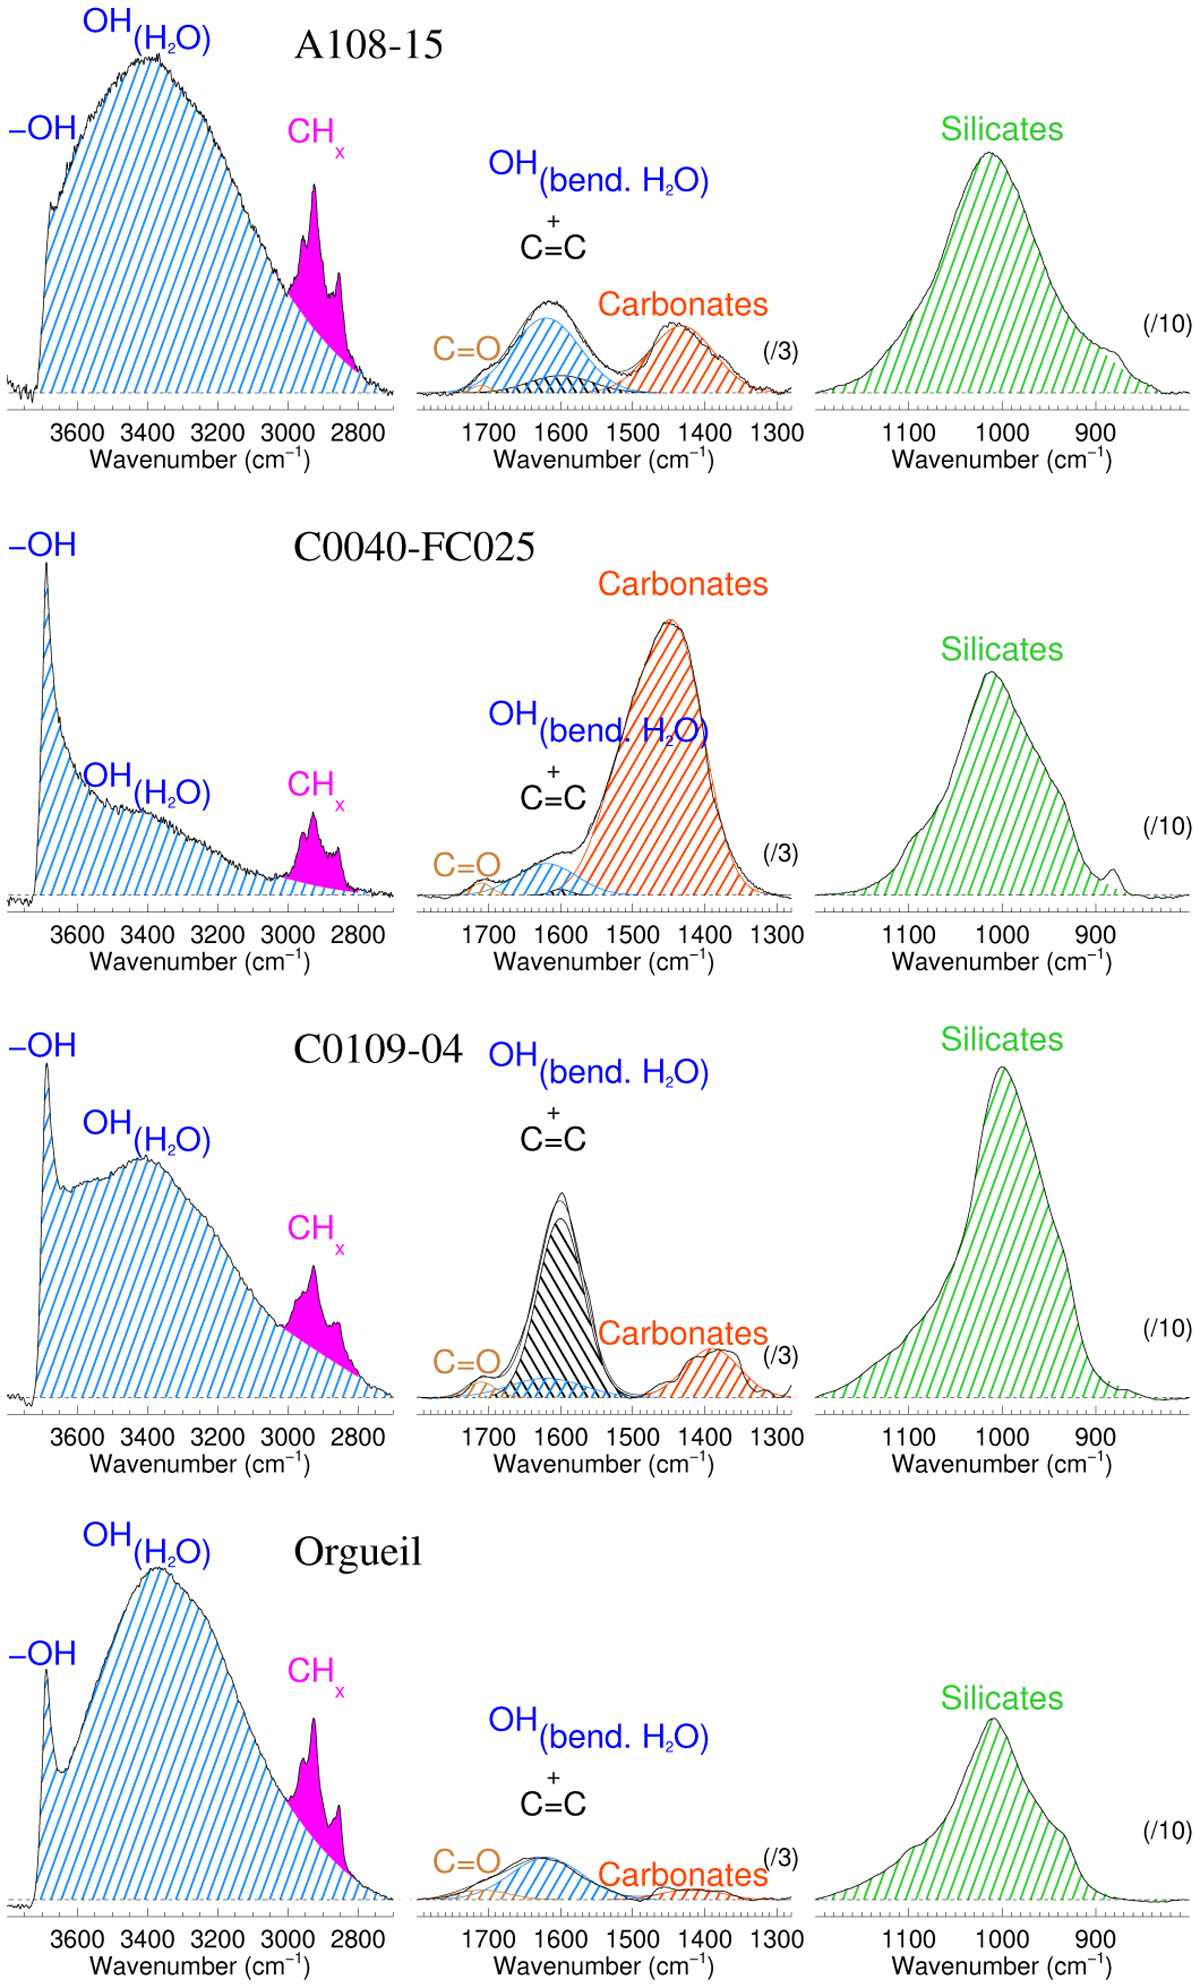
Close-up and deconvolution of the individual bands for the global spectra (corresponding to the maps of Figs. 3 and 4) recorded for sample A0108-15 (03-top-a), upper spectrum, with a high physisorbed and/or interlayer water contribution, and C0040-FC025 (bot-b), second spectrum from top, dominated by the OH hydroxyl contribution. Individual bands are represented by hatching: OH stretch (blue in the 3000–3700 cm−1 region), CH stretch (magenta), C=0 carbonyl stretch (brown), OH bending (blue around 1640 cm−1), aromatic C=C bending (black), carbonates (red), and silicates (green). Each wavenumber range is normalised with regard to the high wavenumber range by a factor (indicated in parenthesis) for clarity of the deconvolution. The spectrum of a particularly C-aromatic-rich grain, C0109-04 (top-a), is also shown. For comparison, a spectrum taken from Orgueil, which was prepared and recorded in the same conditions as the Ryugu samples, is shown at the bottom. See text for details.
Current usage metrics show cumulative count of Article Views (full-text article views including HTML views, PDF and ePub downloads, according to the available data) and Abstracts Views on Vision4Press platform.
Data correspond to usage on the plateform after 2015. The current usage metrics is available 48-96 hours after online publication and is updated daily on week days.
Initial download of the metrics may take a while.