Fig. 10
Download original image
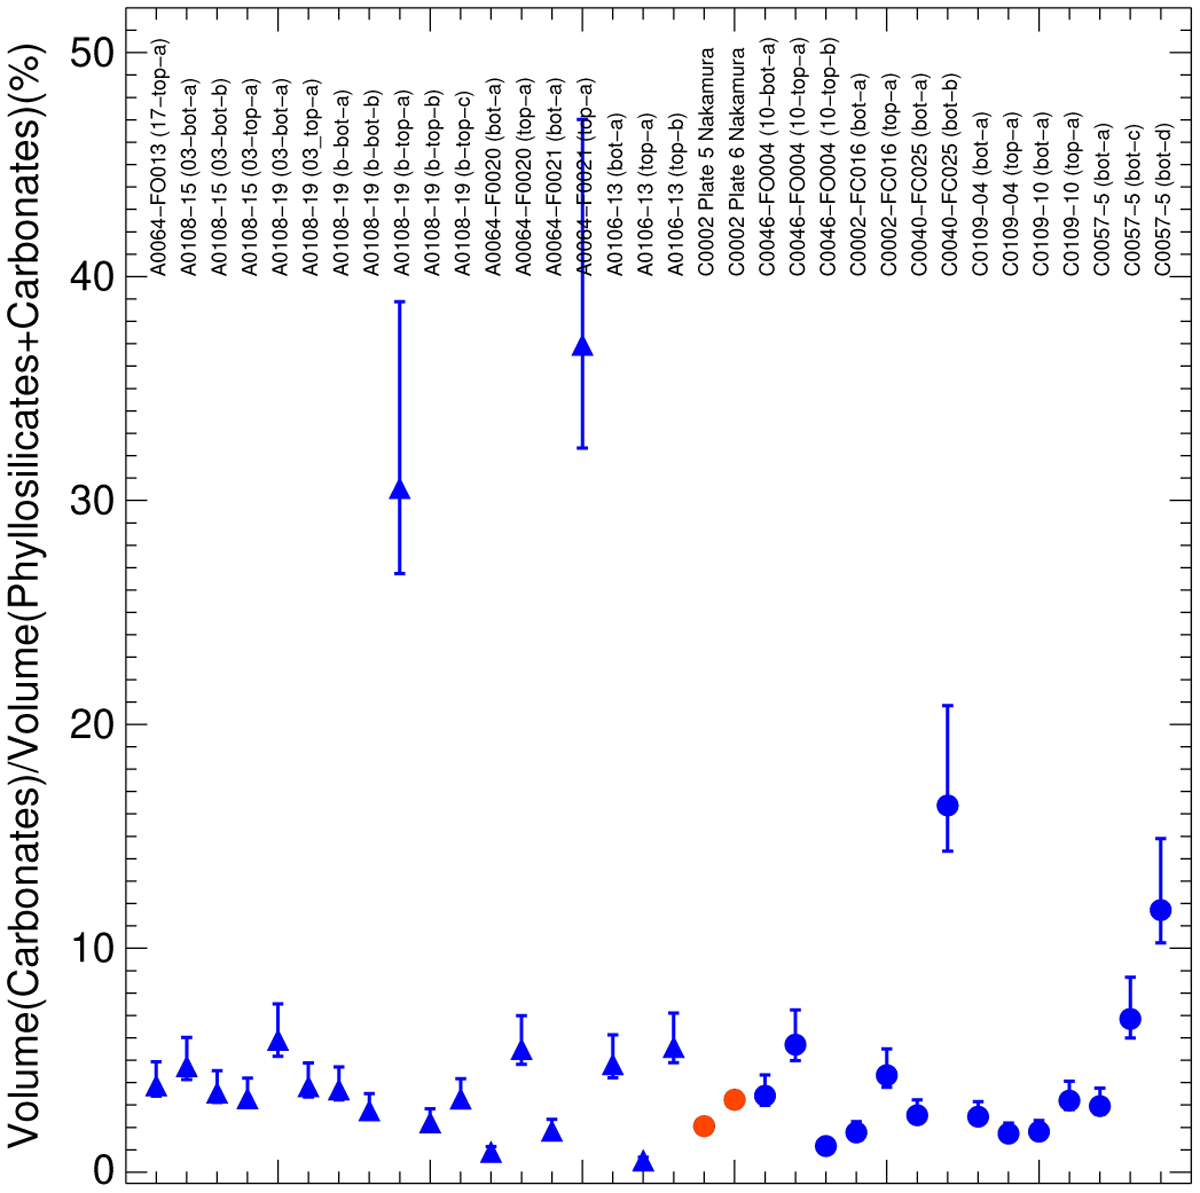
Relative volume ratio of carbonates to (carbonates + phyllosili-cates) in the Ryugu samples (in %), calculated using Eq. (13). Samples from chamber A are plotted as blue triangles and chamber C samples are represented as blue dots (see text for details). Two measurements on polished sections of chamber C samples are reported for comparison as filled red dots (Table S6 of Nakamura et al. 2023).
Current usage metrics show cumulative count of Article Views (full-text article views including HTML views, PDF and ePub downloads, according to the available data) and Abstracts Views on Vision4Press platform.
Data correspond to usage on the plateform after 2015. The current usage metrics is available 48-96 hours after online publication and is updated daily on week days.
Initial download of the metrics may take a while.