Fig. 4.
Download original image
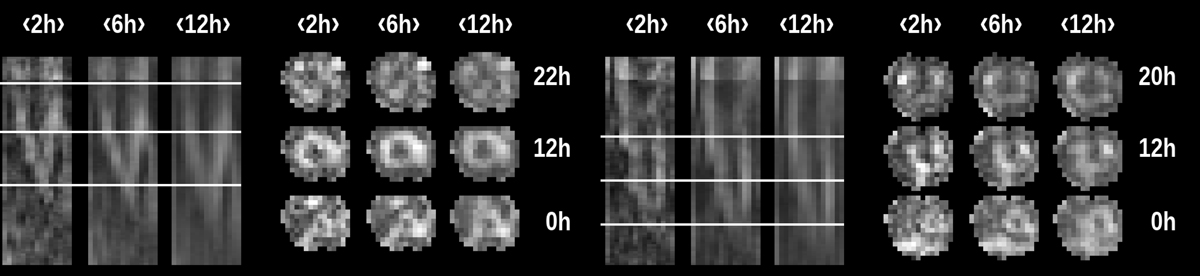
Two examples of donut evolution from their birth (a central hole appears) to their death (broken structure). Temporal cuts with different temporal averaging windows (2 h, 6 h, and 12 h) in the center of each donut (on the left of each example) are shown. On the right side, for each donut, cuts are shown at different times (0 h, 12 h, and 22 h left donut example) and (0 h, 12 h, and 20 h for the right donut example). These times are overplotted for each donut in their temporal respective cuts. In each case, the birth and death times correspond to the low and top white line of the respective temporal cuts. Plotted fields span 8″ × 8″ (5.8 × 5.8 Mm2).
Current usage metrics show cumulative count of Article Views (full-text article views including HTML views, PDF and ePub downloads, according to the available data) and Abstracts Views on Vision4Press platform.
Data correspond to usage on the plateform after 2015. The current usage metrics is available 48-96 hours after online publication and is updated daily on week days.
Initial download of the metrics may take a while.