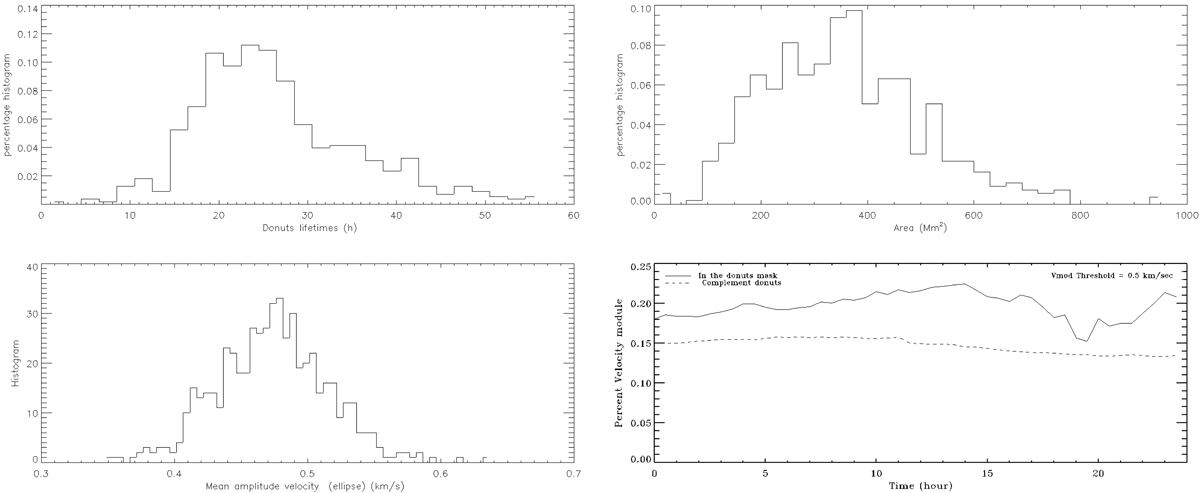
Fig. 3.
Download original image
Top: Distribution of donut lifetimes (left) and distribution of donut areas corrected for projection effects (right). Bottom: Distribution of mean velocities inside donuts (left) and percentage of the area with a velocity greater than 0.5 km/s in donuts (solid line) and in the complementary field (dashed line) at the disk center ±20° in latitude and longitude (right). These distributions come from data from 29 November 2018.
Current usage metrics show cumulative count of Article Views (full-text article views including HTML views, PDF and ePub downloads, according to the available data) and Abstracts Views on Vision4Press platform.
Data correspond to usage on the plateform after 2015. The current usage metrics is available 48-96 hours after online publication and is updated daily on week days.
Initial download of the metrics may take a while.