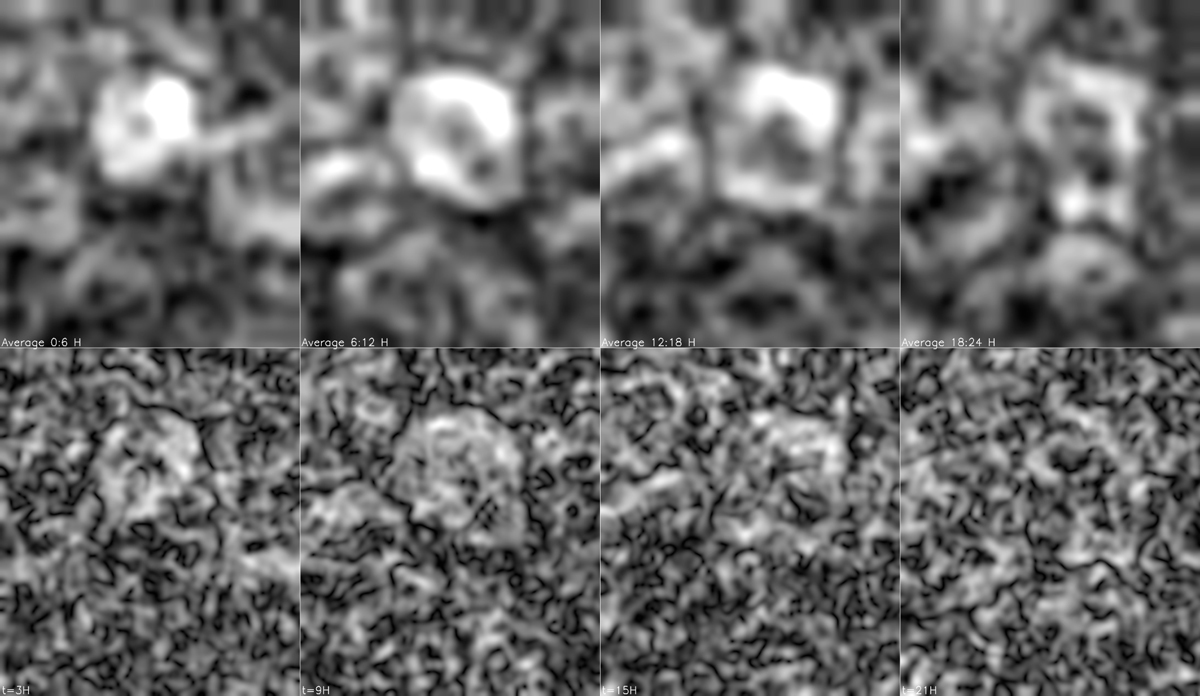
Fig. 2.
Download original image
Top row shows the evolution of the horizontal flow modulus observed by Hinode from 29 August 2007, 10:17 UT to 31 August 2007, 10:19 UT, with a spatial resolution degraded to the one HMI/SDO. In each frame, the flow modulus is averaged over 6 h. Each frame is separated by a time step δt = 6 h. The bottom images represent the 30-min averaged horizontal flow modulus corresponding to the middle time of each averaged top modulus maps. Fields of view span 90″ × 93″ (62.25 × 67.43 Mm2).
Current usage metrics show cumulative count of Article Views (full-text article views including HTML views, PDF and ePub downloads, according to the available data) and Abstracts Views on Vision4Press platform.
Data correspond to usage on the plateform after 2015. The current usage metrics is available 48-96 hours after online publication and is updated daily on week days.
Initial download of the metrics may take a while.