Fig. 16.
Download original image
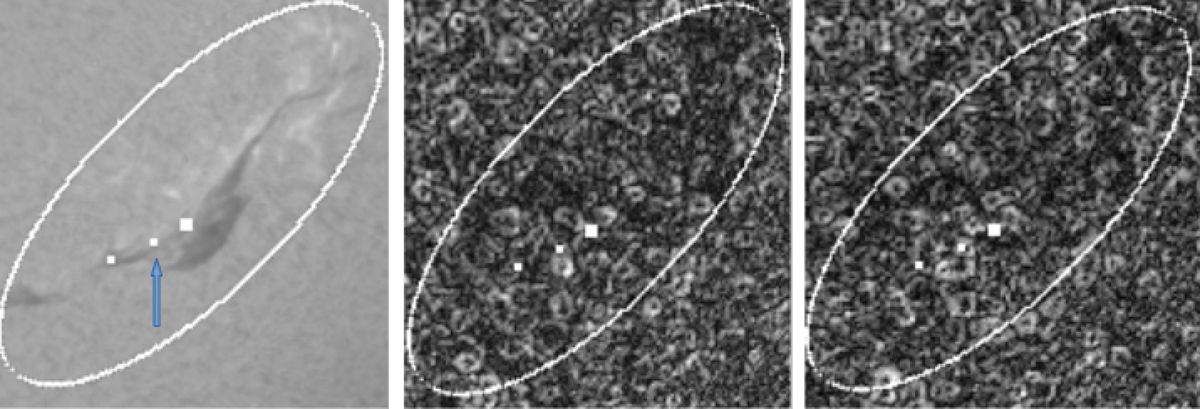
Filament eruption in the Hα line, on the left, on 26 January 2016 (16:30). The square, indicated by the arrow, indicates the foot where the eruption started at 17:00. The middle and right images represent the horizontal velocity modulus at time 12:00 and 16:00, respectively. For both images, intense donuts are observed close to 12:00 and at the location foot eruption at 16:00. The field of view is 561″ × 572″ (401 × 408 Mm2).
Current usage metrics show cumulative count of Article Views (full-text article views including HTML views, PDF and ePub downloads, according to the available data) and Abstracts Views on Vision4Press platform.
Data correspond to usage on the plateform after 2015. The current usage metrics is available 48-96 hours after online publication and is updated daily on week days.
Initial download of the metrics may take a while.