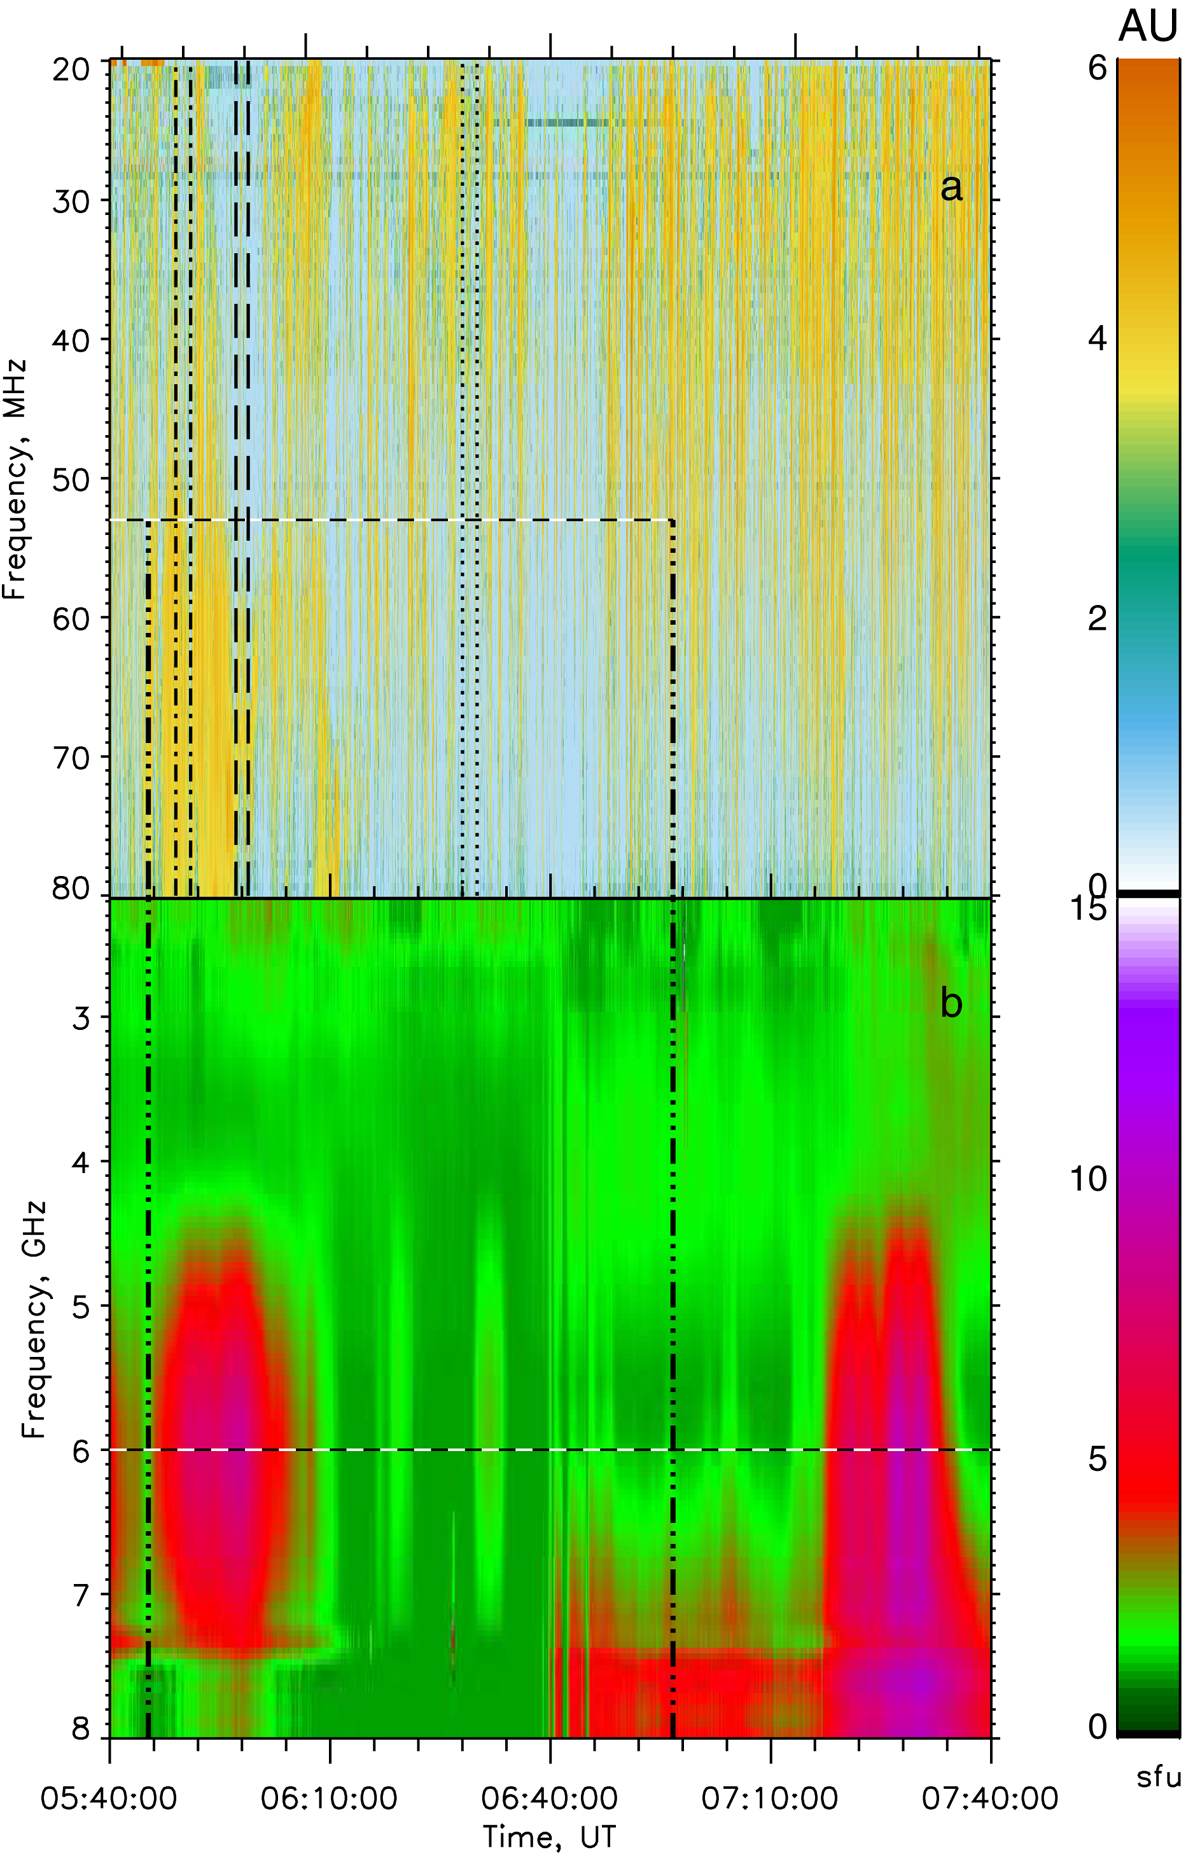
Fig. 1.
Download original image
Dynamic spectra on 13 April 2019, recorded by LOFAR (a) and BBMS in microwaves (b). The box in panel (a) with the bounds at 05:45:15 and 06:56:40 gives the spectrum region for which there is a high cross-correlation coefficient with the microwave emission at 6 GHz. The vertical dash-dotted, dashed, and dotted lines indicate the three time intervals used in Fig. 4. The vertical dash-three-dotted lines restrict the time interval for which the highest correlation coefficient was found.
Current usage metrics show cumulative count of Article Views (full-text article views including HTML views, PDF and ePub downloads, according to the available data) and Abstracts Views on Vision4Press platform.
Data correspond to usage on the plateform after 2015. The current usage metrics is available 48-96 hours after online publication and is updated daily on week days.
Initial download of the metrics may take a while.