Fig. 5
Download original image
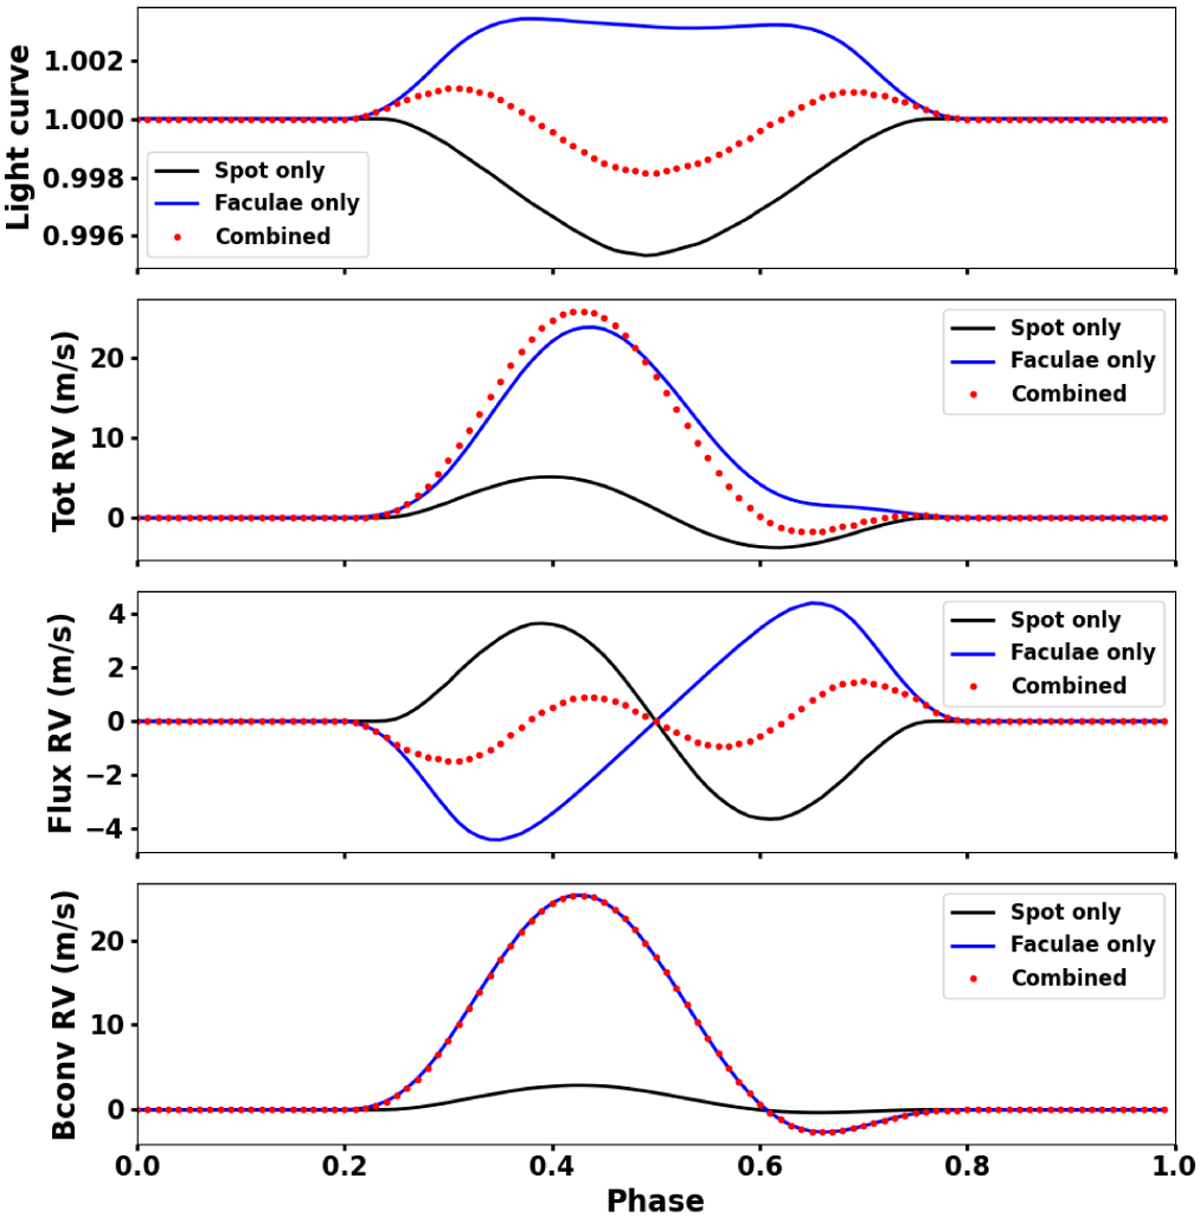
Three different active region configurations are simulated. A single spot located at the latitude of 30° and the longitude of 180° with a fixed size of 1% of the entire solar disk is presented in black. A single facula with the same coordinates and a fixed size of 9% of the entire solar disk is shown in blue line. The 1% spot region surrounded with 9% faclua region is labeled in red dashed line. The top panel demonstrates the light curves of different configurations and the rest of the panels shows the RVs of the total effect, the flux effect, and the CB effect.
Current usage metrics show cumulative count of Article Views (full-text article views including HTML views, PDF and ePub downloads, according to the available data) and Abstracts Views on Vision4Press platform.
Data correspond to usage on the plateform after 2015. The current usage metrics is available 48-96 hours after online publication and is updated daily on week days.
Initial download of the metrics may take a while.