Fig. 4
Download original image
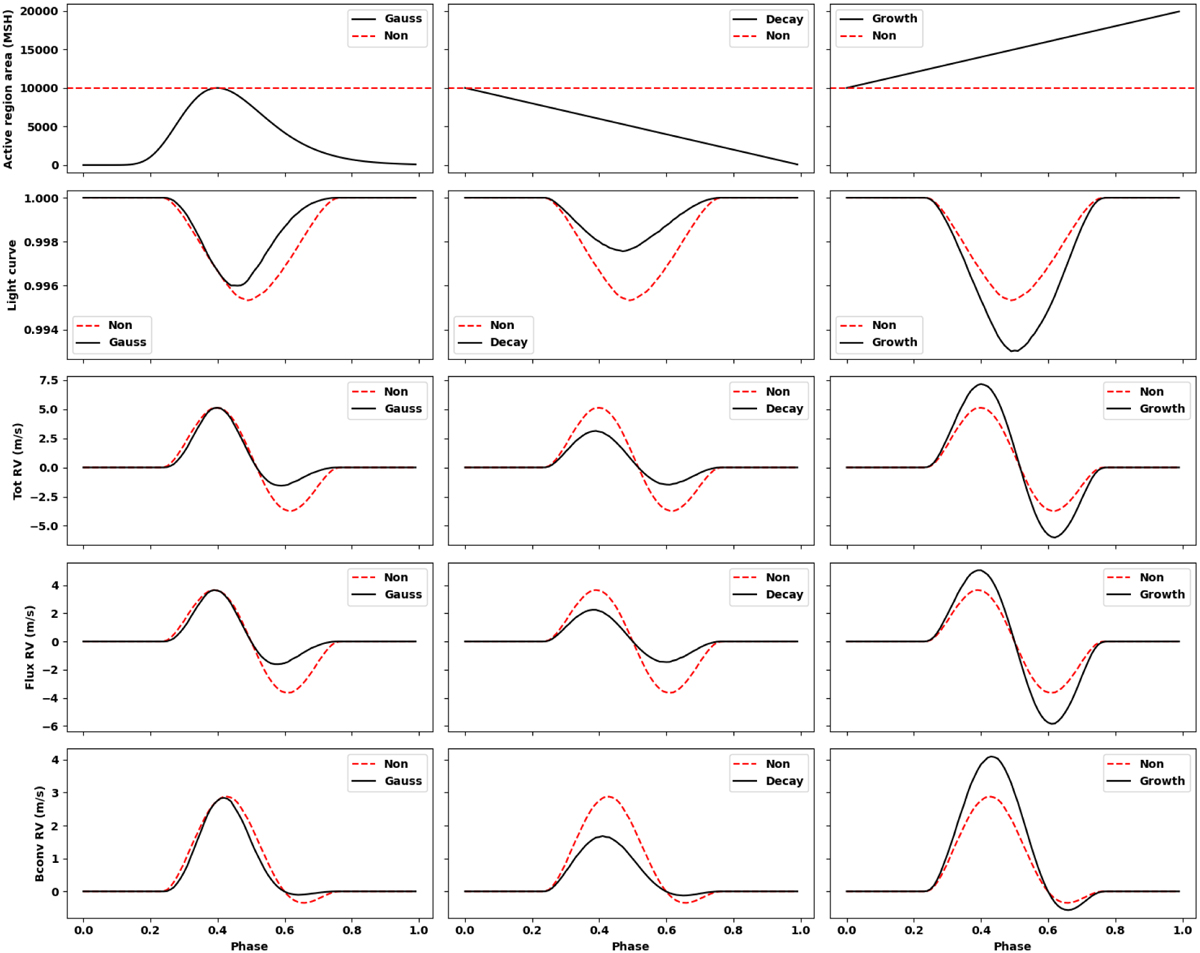
SOAP-GPU simulation of different active region evolution curves: a single spot with a latitude of 30° and longitude of 180° is simulated. Three spot size evolution types are demonstrated: (i) a fast growth and slow decay evolution is shown in the first column, (ii) a linear decay evolution curve in the second column, and (iii) a linear growth curve in the third column. The evolution curves and the simulated light curves are shown in the first two rows. The RVs of the total effect, the flux effect, and the CB effect are present in the rest of the rows. The simulation of an non-evolving spot (red dashed line) is also shown in each figure for comparison.
Current usage metrics show cumulative count of Article Views (full-text article views including HTML views, PDF and ePub downloads, according to the available data) and Abstracts Views on Vision4Press platform.
Data correspond to usage on the plateform after 2015. The current usage metrics is available 48-96 hours after online publication and is updated daily on week days.
Initial download of the metrics may take a while.