Fig. 3
Download original image
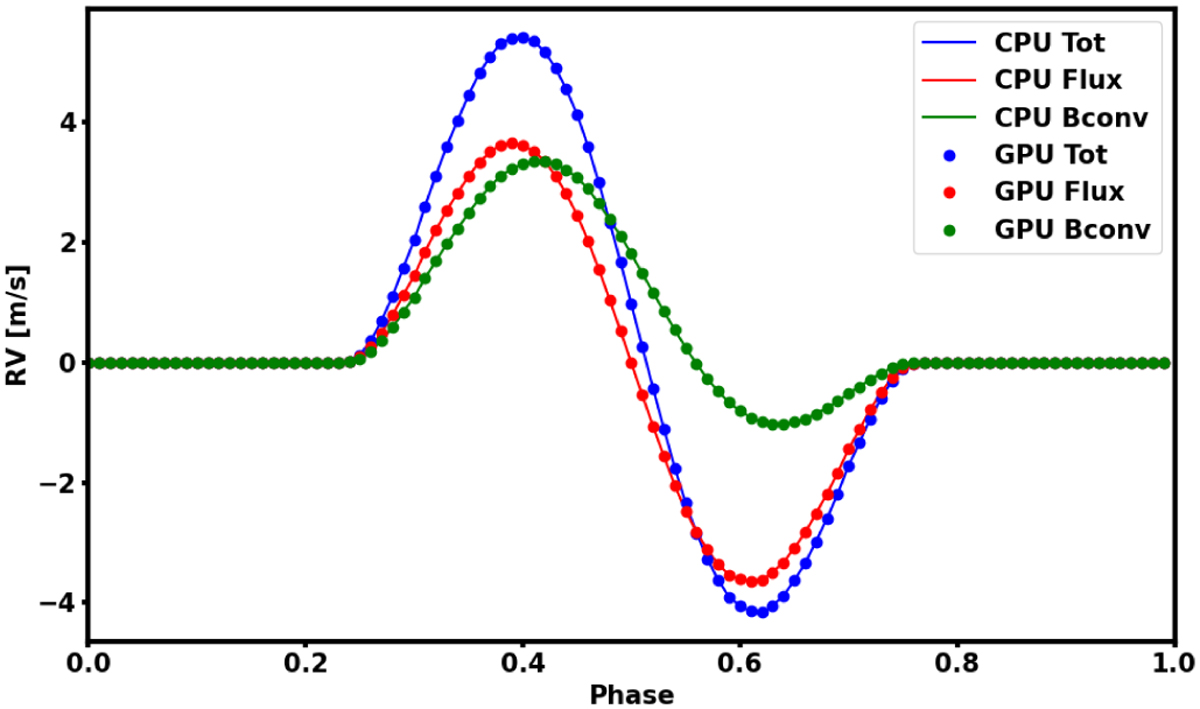
Comparison of the RVs derived from the simulated spectra modeled by SOAP2.0 and SOAP-GPU. A single equatorial spot with 1% area of the entire disk surface is simulated. It took 1749.3 s to simulate those spectra with SOAP 2.0, while only 27.9 s with SOAP-GPU on a Nvidia RTX-3090 card. The computation speed is improved by a factor of 63.
Current usage metrics show cumulative count of Article Views (full-text article views including HTML views, PDF and ePub downloads, according to the available data) and Abstracts Views on Vision4Press platform.
Data correspond to usage on the plateform after 2015. The current usage metrics is available 48-96 hours after online publication and is updated daily on week days.
Initial download of the metrics may take a while.