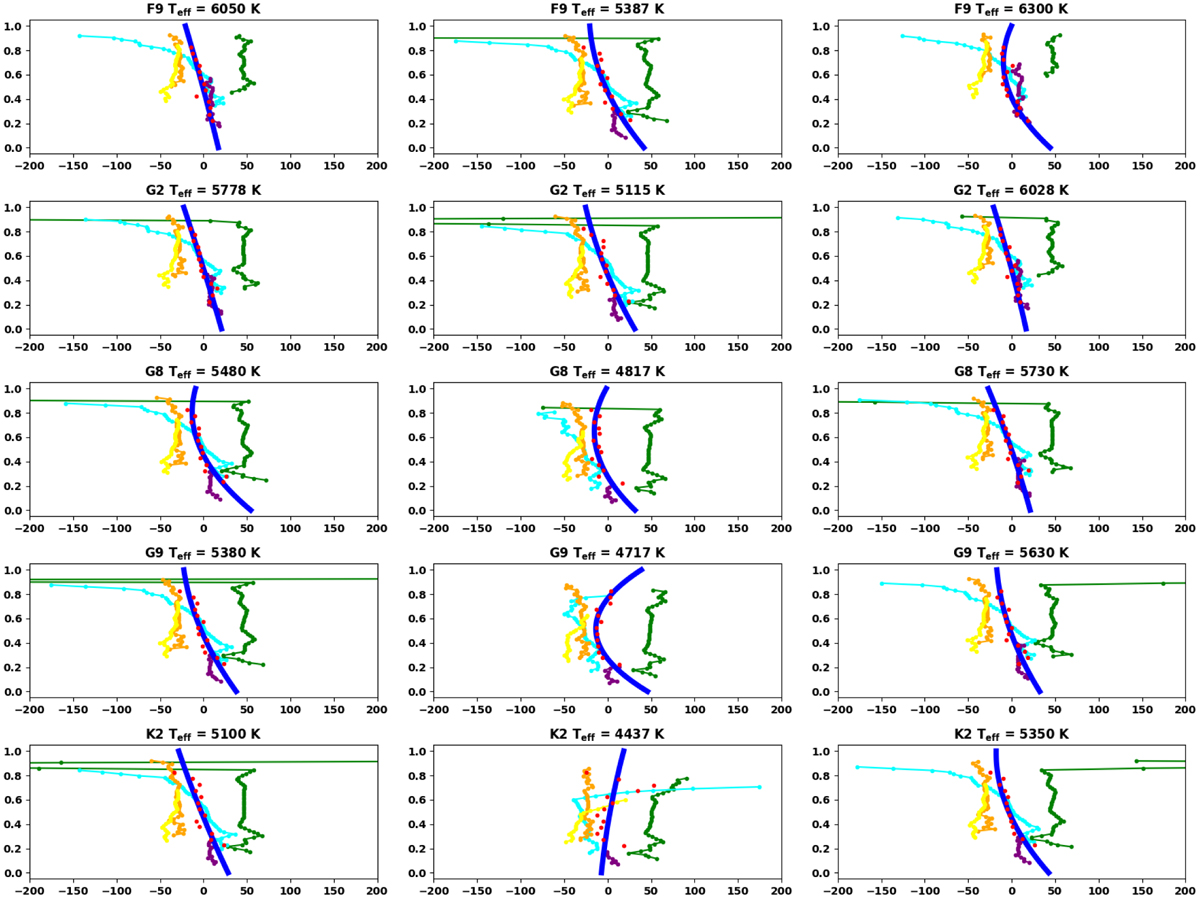
Fig. A.1
Download original image
Bisector of PHOENIX spectra. For each input seed spectrum using PHOENIX spectral library, we use five strong iron lines: FeI 5250.2084Å (green), FeI 5250.6453Å (cyan), FeI 5434.5232Å (purple), FeI 6173.3344Å (orange), and FeI 6301.5008Å (yellow) to measure the average bisector of the input spectra. Bisector outliers outside a window of 0.1Å around each line center are rejected to avoid those points, certainly affected by line blending, to bias our measurement of line bisector. Each line corresponds to a different spectral type and (from left to right) we can see the bisector of the spectrum used for the quiet photosphere, a spot region (663 K cooler) and a facula region (250 K hotter). We average those line bisectors at certain depth (as shown by the red dots) and fit the obtained data with a second order polynomial. The fitted bisector is used to remove the bisector of input seed spectrum.
Current usage metrics show cumulative count of Article Views (full-text article views including HTML views, PDF and ePub downloads, according to the available data) and Abstracts Views on Vision4Press platform.
Data correspond to usage on the plateform after 2015. The current usage metrics is available 48-96 hours after online publication and is updated daily on week days.
Initial download of the metrics may take a while.