Fig. 13
Download original image
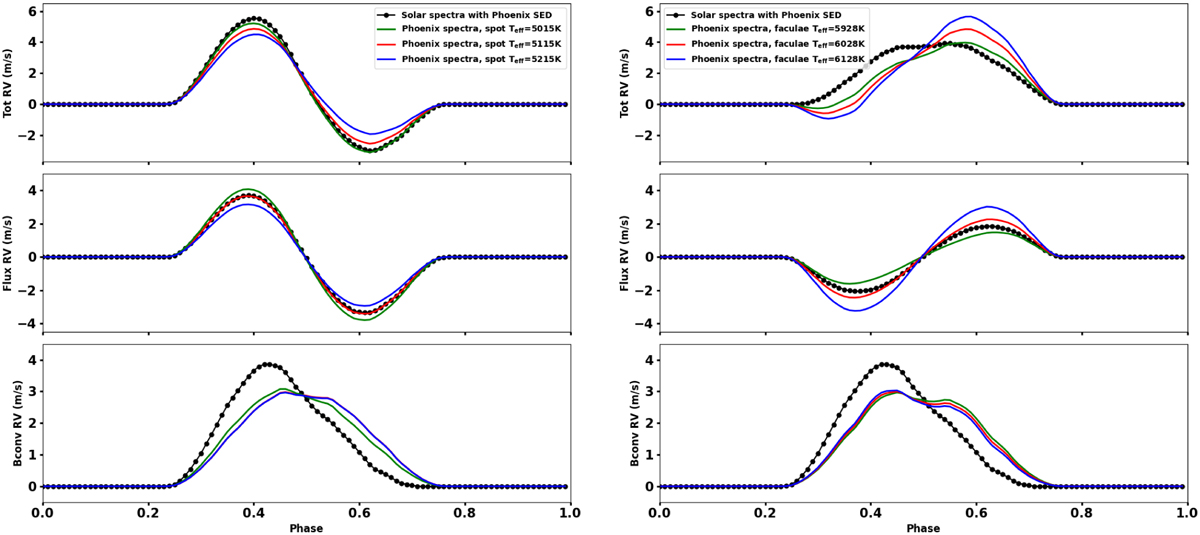
Simulation of an equatorial 1% spot (left) and 1% facula (right) with different temperatures using PHOENIX spectral library. The quiet Sun spectrum is extracted from PHOENIX spectral library with log(g) of 4.5 and Teff = 5778 K. The effective temperature of the spot spectra are 5015, 5115, and 5215 K, and for the facula spectra, they are: 5928, 6028, and 6128 K. We also show the results of using the observed Kitt Peak solar spectra, including the PHOENIX SEDs (using Eqs. (10)–(12)). The μ dependent CB is included in the simulations. Left: for the spot, we see that when the difference in temperature between the spot and the quiet photosphere increases, the RV flux effect becomes larger. We note a rather large discrepancy in the CB effect between the observed solar and PHOENIX input spectra. This is likely due to the fact that the observed solar spectra are not well normalized (see Sect. 4.3.3). Right: for the facula, we note the same problem of negative values for the CB effect, which are expected since the same badly normalized solar active spectrum is used. We also see that considering the corresponding PHOENIX SED when using the observed solar spectra significantly change the flux contribution (see Sect. 4.3.3). Considering the PHOENIX SED gives results much closer to the PHOENIX simulations.
Current usage metrics show cumulative count of Article Views (full-text article views including HTML views, PDF and ePub downloads, according to the available data) and Abstracts Views on Vision4Press platform.
Data correspond to usage on the plateform after 2015. The current usage metrics is available 48-96 hours after online publication and is updated daily on week days.
Initial download of the metrics may take a while.