Fig.11
Download original image
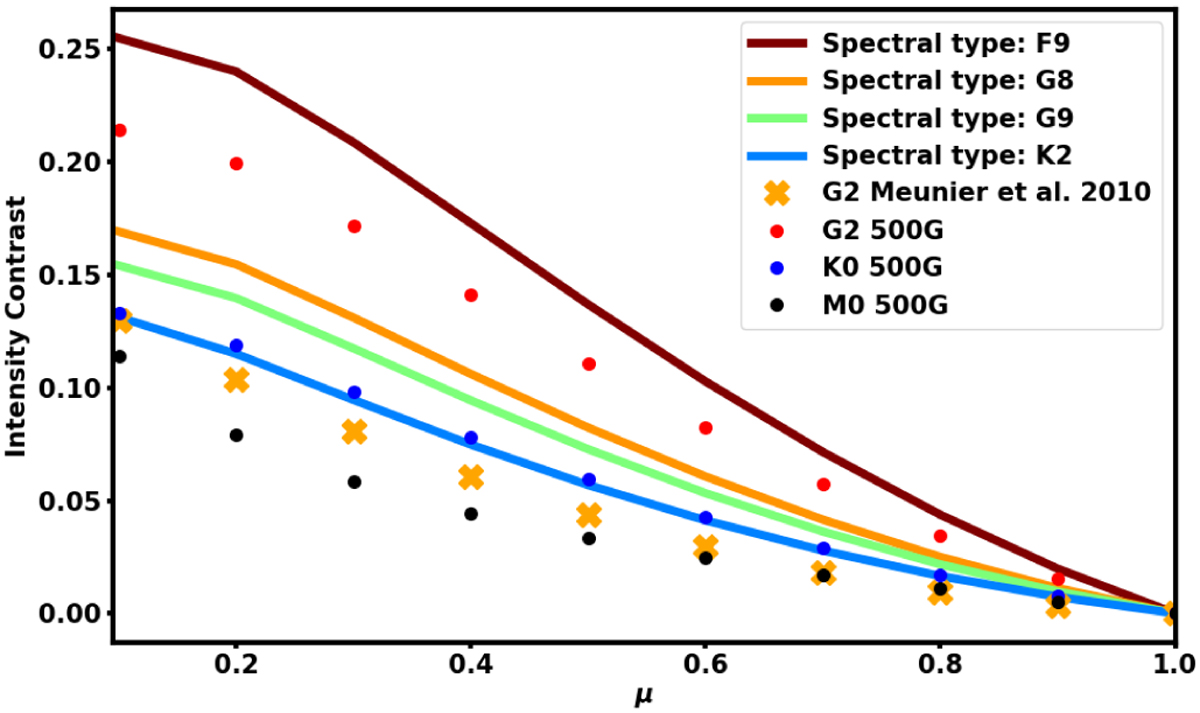
Faculae intensity contrast as a function of μ for different spectral types. The limb brightening curves for the G2, K0 and M0 dwarfs are derived from the parametrization of MHD simulations for 500G faculae, shown in Table 1 in Johnson et al. (2021). The limb brightening curves for other spectral types are linearly interpolated by using the two closet limb brightening curves. For spectral types hotter than G2, we obtained the limb brightening by performing linear extrapolation using the G2 and K0 curves. The limb brightening derived from Meunier et al. (2010) is labeled with orange.
Current usage metrics show cumulative count of Article Views (full-text article views including HTML views, PDF and ePub downloads, according to the available data) and Abstracts Views on Vision4Press platform.
Data correspond to usage on the plateform after 2015. The current usage metrics is available 48-96 hours after online publication and is updated daily on week days.
Initial download of the metrics may take a while.