Fig. 10
Download original image
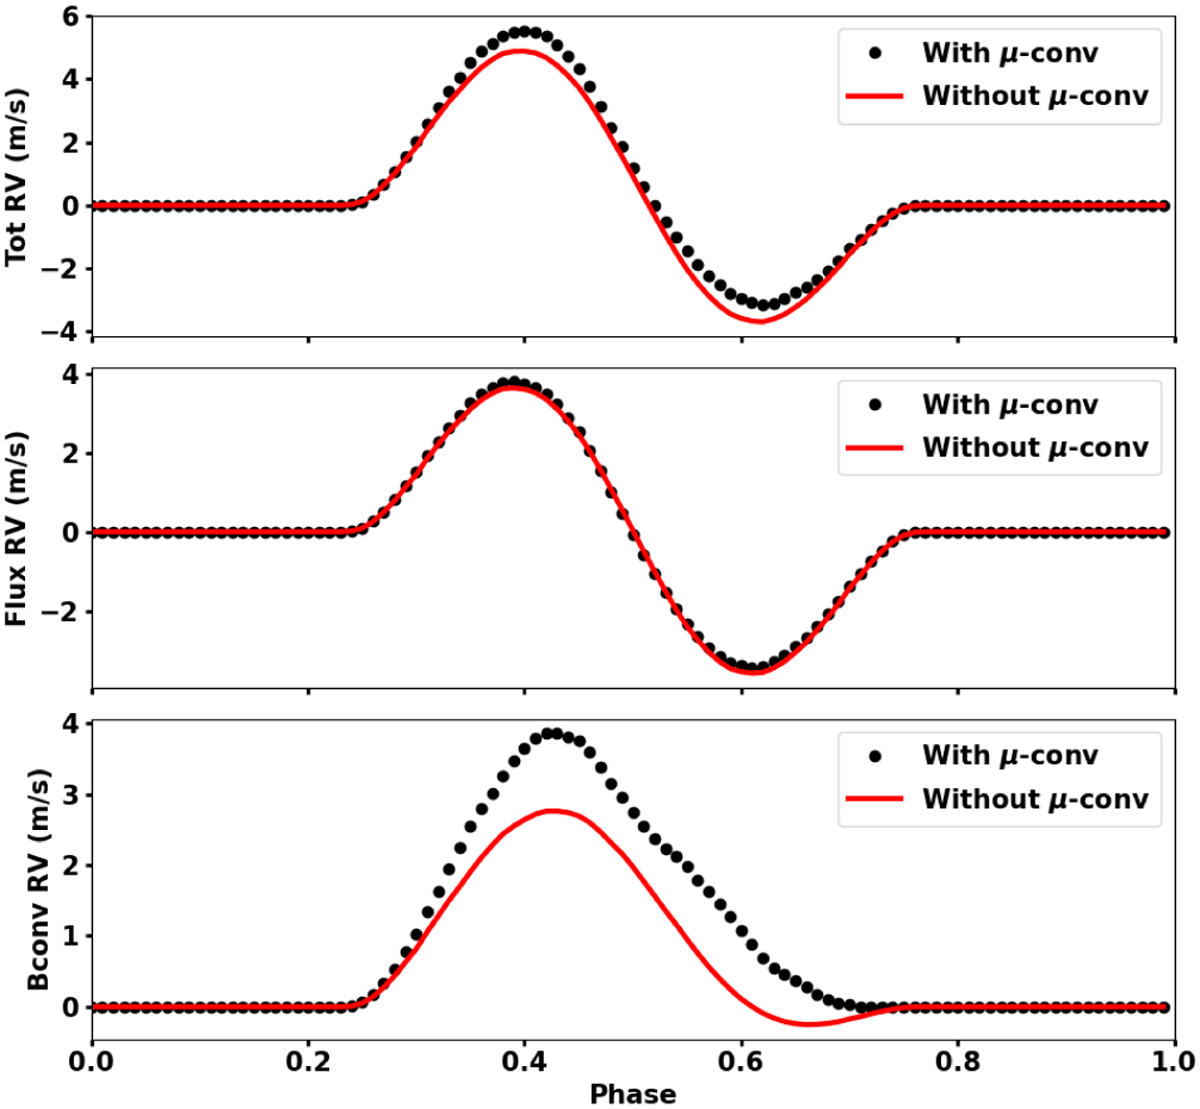
Comparison of the RVs derived using two different configurations for the input spectra. A single equatorial spot with 1% area of the entire disk surface is simulated in both cases. Red line: RVs derived from simulated spectra with observed quiet sun and spot spectra without μ dependent bisector injection. Dotted line: RVs derived from simulated spectra with μ dependent bisector injection. The input spectra with μ-angle dependency are generated with the Python module Convec.model. The RVs of the flux, CB, and total effect do not change significantly when the μ-dependent CB is introduced.
Current usage metrics show cumulative count of Article Views (full-text article views including HTML views, PDF and ePub downloads, according to the available data) and Abstracts Views on Vision4Press platform.
Data correspond to usage on the plateform after 2015. The current usage metrics is available 48-96 hours after online publication and is updated daily on week days.
Initial download of the metrics may take a while.