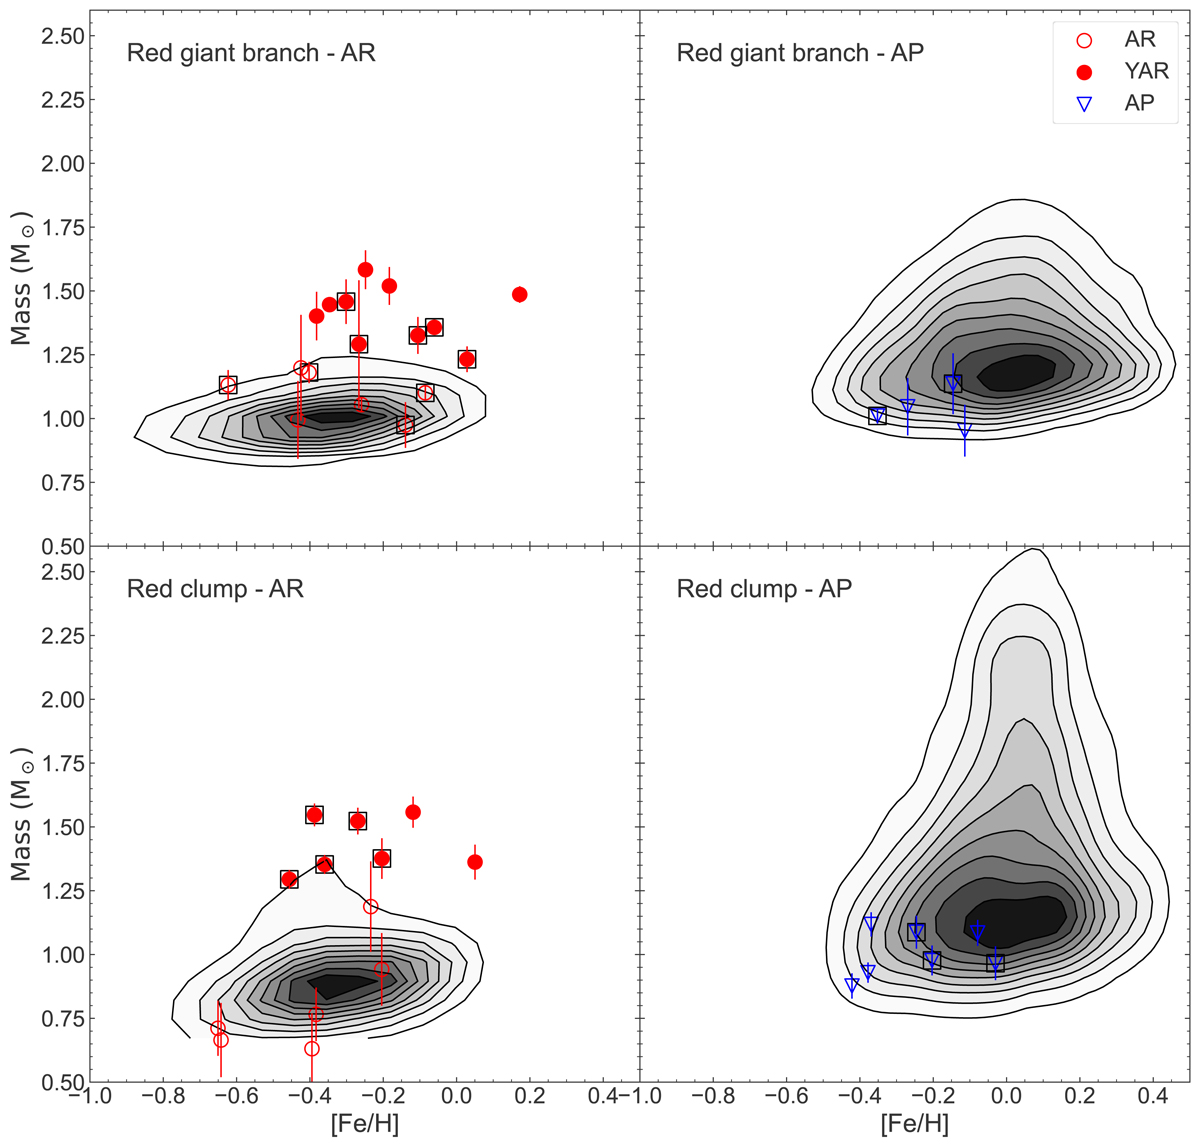
Fig. 8.
Download original image
Metallicities and masses of our stars alongside with the density distribution of APOKASC-3 for RGB stars (upper panel) and RC stars (lower panel). The α-rich stars are plotted in the left-hand panels, and the α-poor stars are plotted in the right-hand panels. The chemical separation uses Eq. (2). Contours indicate the percentages 10, 20, 30%, and so on of the APOKASC-3 distributions. The outer contour corresponds to 90% of the stars being inside the distribution.
Current usage metrics show cumulative count of Article Views (full-text article views including HTML views, PDF and ePub downloads, according to the available data) and Abstracts Views on Vision4Press platform.
Data correspond to usage on the plateform after 2015. The current usage metrics is available 48-96 hours after online publication and is updated daily on week days.
Initial download of the metrics may take a while.