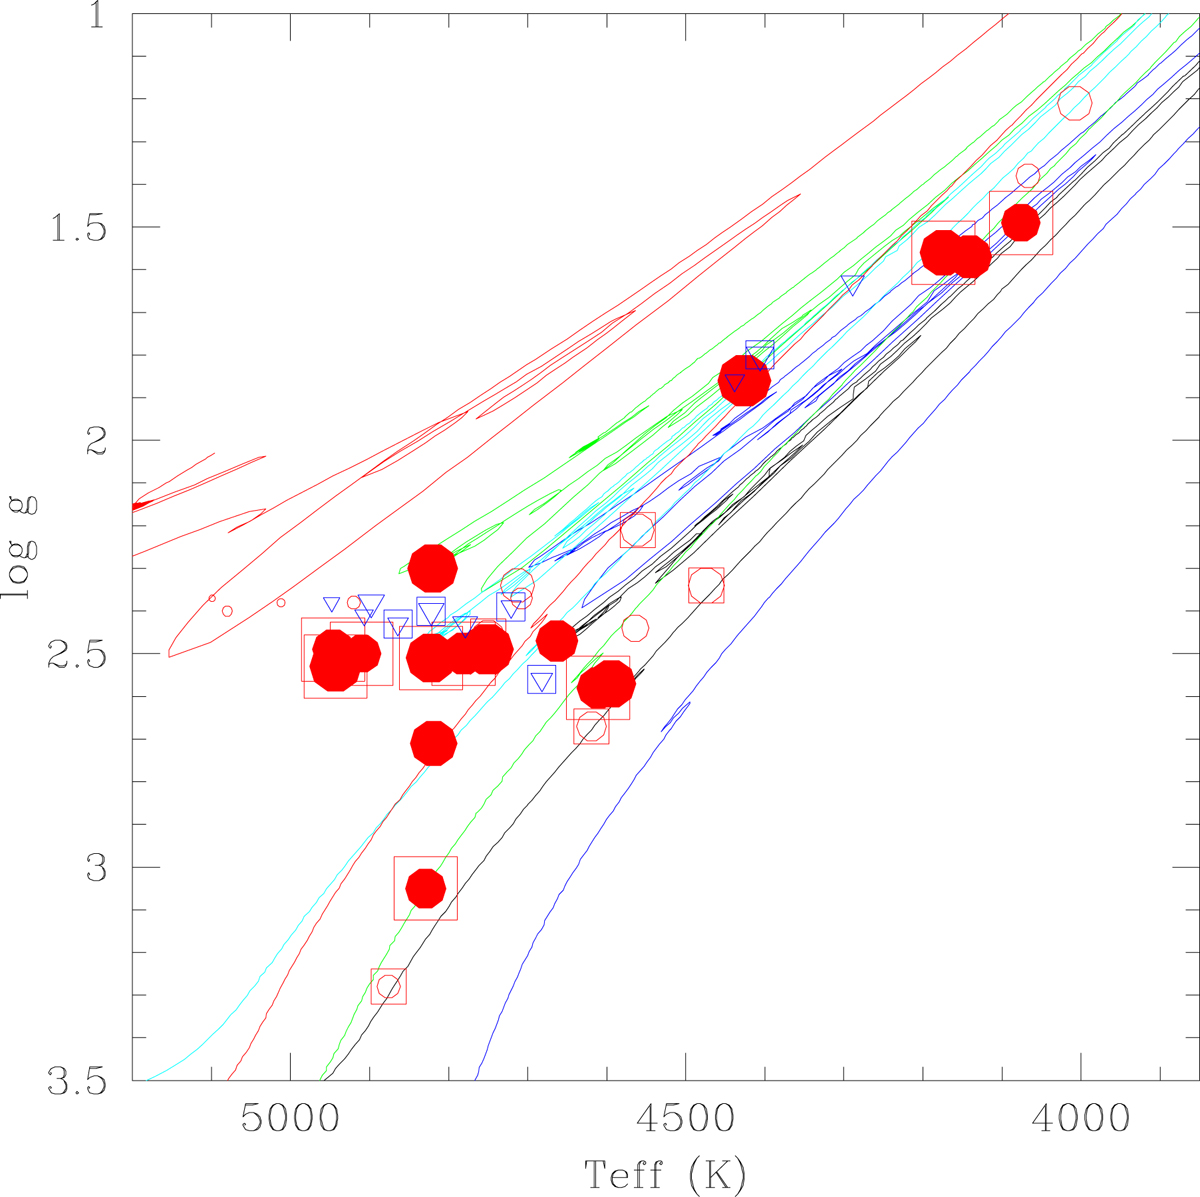
Fig. 7.
Download original image
Kiel diagram (Teff, log g) for the sample stars. The symbol radius is proportional to the mass. Evolutionary tracks from STAREVOL (see text) have been overplotted for stars with [Fe/H] = 0, and masses of 1 M⊙ (blue curve), 1.5 M⊙ (black curve). Also plotted are tracks for [Fe/H] = −0.25, 1 M⊙ (green curve) and 1.5 M⊙ (cyan curve), and [Fe/H] = −0.5, 0.9 M⊙ (red curve).
Current usage metrics show cumulative count of Article Views (full-text article views including HTML views, PDF and ePub downloads, according to the available data) and Abstracts Views on Vision4Press platform.
Data correspond to usage on the plateform after 2015. The current usage metrics is available 48-96 hours after online publication and is updated daily on week days.
Initial download of the metrics may take a while.