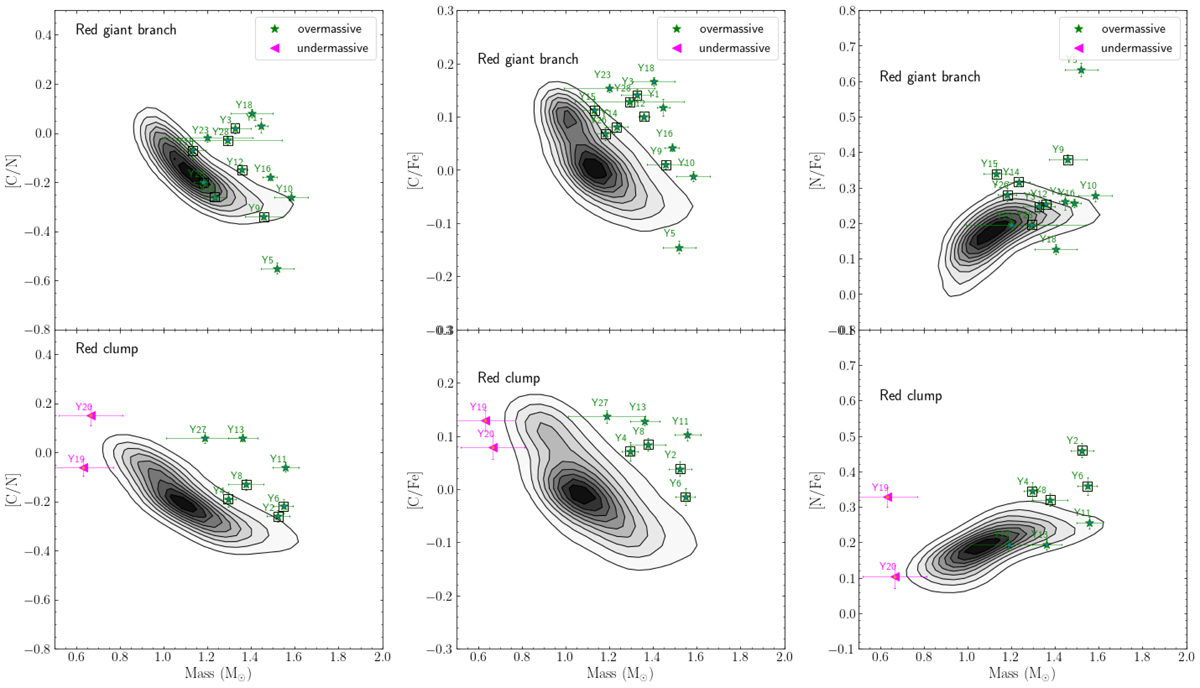
Fig. 13.
Download original image
Left: [C/N]-mass relation for the stars in our sample alongside with the α-rich APOKASC-3 distribution. The upper panel shows the stars classified as RGB and the lower panel shows the RC stars. The symbols follow our new classification based on the contours of Fig. 8. Binary stars are enclosed with squares. Middle and right panels: [C/Fe] and [N/Fe] abundances as a function of mass.
Current usage metrics show cumulative count of Article Views (full-text article views including HTML views, PDF and ePub downloads, according to the available data) and Abstracts Views on Vision4Press platform.
Data correspond to usage on the plateform after 2015. The current usage metrics is available 48-96 hours after online publication and is updated daily on week days.
Initial download of the metrics may take a while.