Fig. 1.
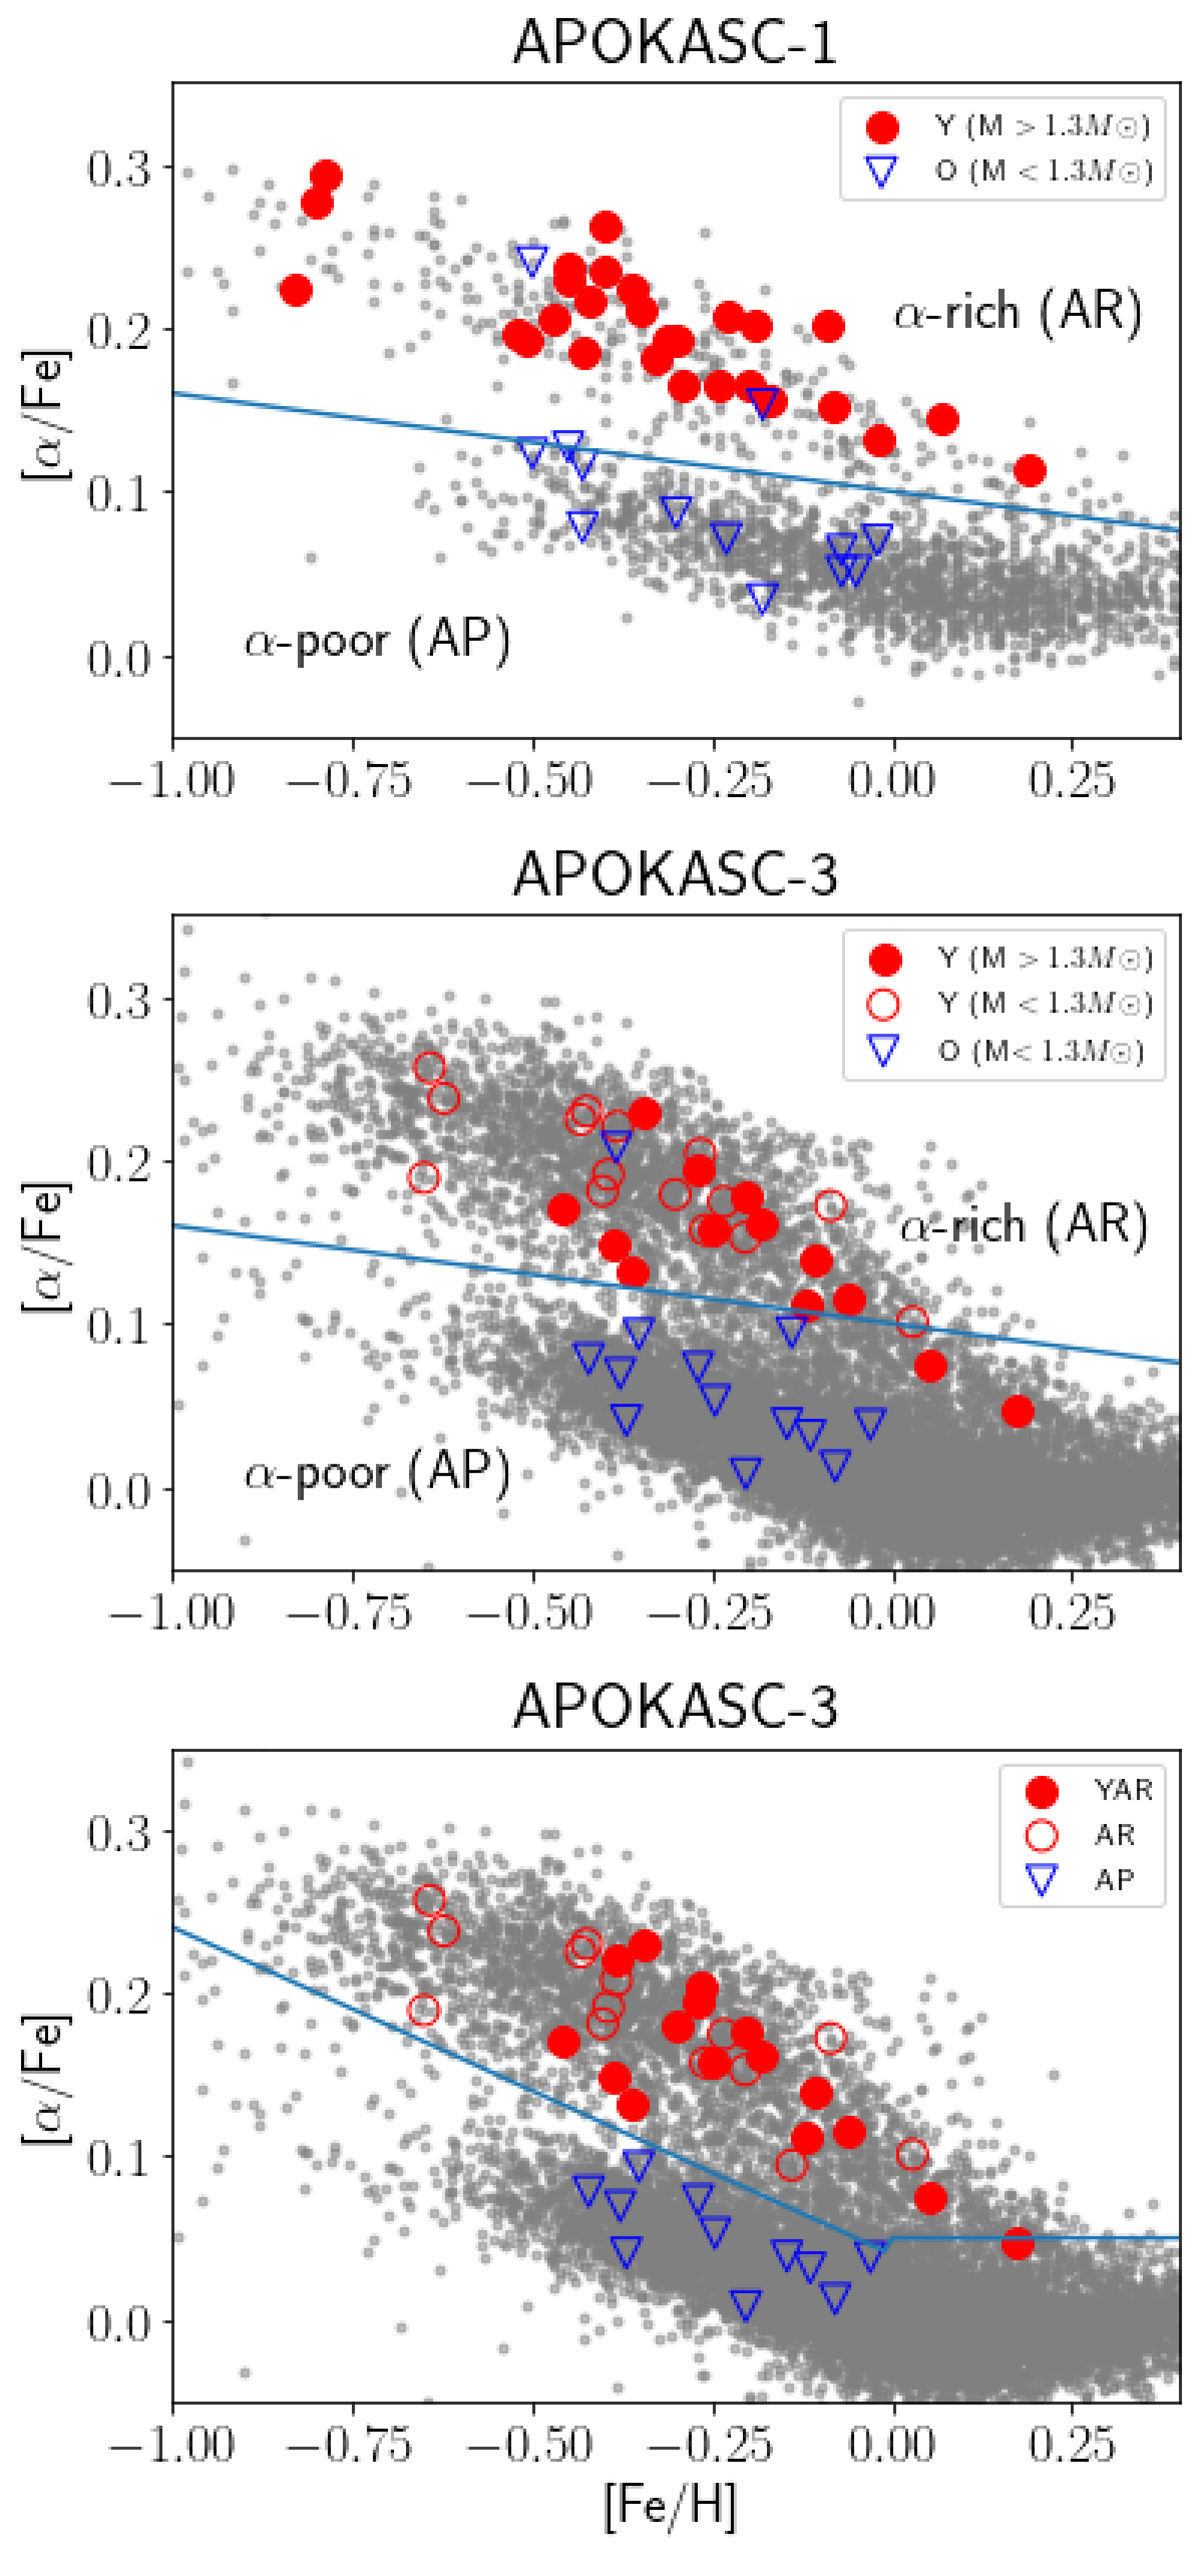
Download original image
Tinsley-Wallerstein diagrams for the stars in our sample alongside with the rest of the APOKASC catalogue version 1 (top panel) or version 3 (middle and bottom panels). The blue lines indicate different thresholds between α-rich (“AR”) and α-poor (“AP”) stars: Eq. (1) for the middle panel and Eq. (2) for the bottom panel, see Sect. 2. Filled symbols represent stars whose mass is above 1.3 M⊙ and open symbols represent stars with masses below that limit. The mass is taken from APOKASC-1 (top panel) or APOKASC-3 (middle and bottom panels). The bottom panel indicates our final classification as YAR, α-rich (AR) or α-poor (AP; see text).
Current usage metrics show cumulative count of Article Views (full-text article views including HTML views, PDF and ePub downloads, according to the available data) and Abstracts Views on Vision4Press platform.
Data correspond to usage on the plateform after 2015. The current usage metrics is available 48-96 hours after online publication and is updated daily on week days.
Initial download of the metrics may take a while.