Fig. 7
Download original image
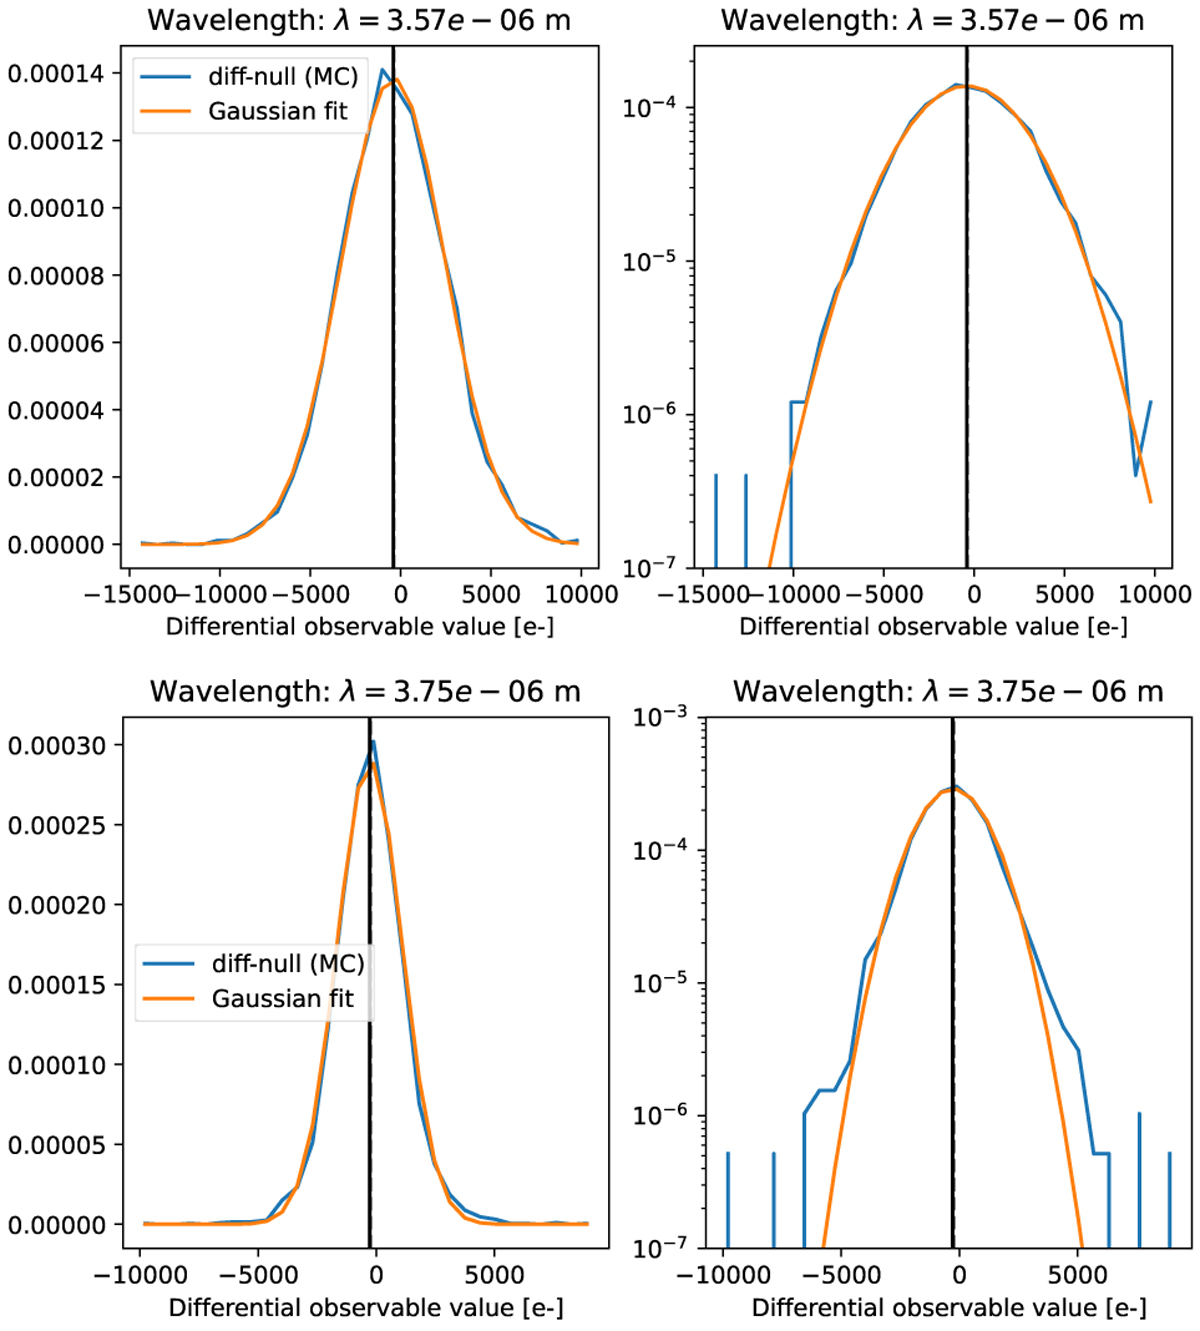
Samples of the empirical probability density function of the total error for the 3.57 (top) and 3.75 (bottom) µm bins computed with 3000 samples of 3 s DITs with spectral resolution R ≈ 400. The density function is displayed in linear scale (left) and in log scale (right). Some kurtosis is noticeable in log scale, causing the Shapiro-Wilk test to reject the Gaussian hypothesis in parts of the spectrum but the Gaussian distribution remains a relevant approximation.
Current usage metrics show cumulative count of Article Views (full-text article views including HTML views, PDF and ePub downloads, according to the available data) and Abstracts Views on Vision4Press platform.
Data correspond to usage on the plateform after 2015. The current usage metrics is available 48-96 hours after online publication and is updated daily on week days.
Initial download of the metrics may take a while.