Open Access
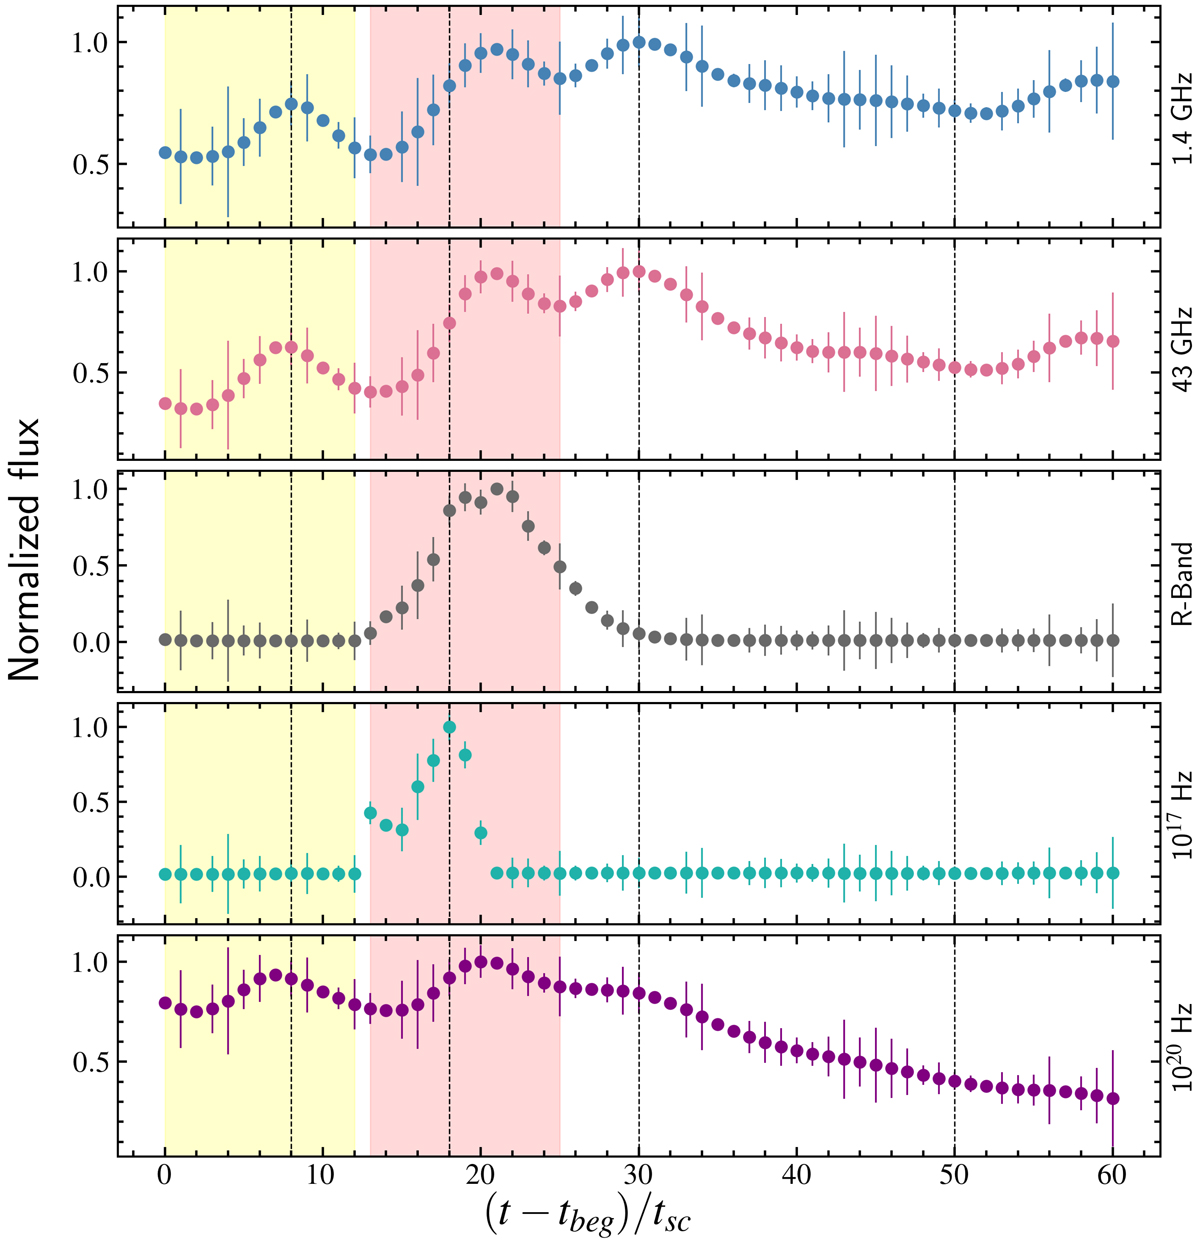
Fig. 7.
Download original image
Simulated light curve for the Ref_s1 case. The observing frequencies and other details are same as Fig. 6. The flux values from top to bottom are normalized to their maximum values of 2.58 × 10⁻¹⁸, 7.99 × 10⁻¹⁹, 6.65 × 10⁻²³, 1.9 × 10⁻²⁵, and 3.99 × 10⁻³², respectively, and given in the units of ergs s−1 cm−2 Hz−1.
Current usage metrics show cumulative count of Article Views (full-text article views including HTML views, PDF and ePub downloads, according to the available data) and Abstracts Views on Vision4Press platform.
Data correspond to usage on the plateform after 2015. The current usage metrics is available 48-96 hours after online publication and is updated daily on week days.
Initial download of the metrics may take a while.