Fig. 6.
Download original image
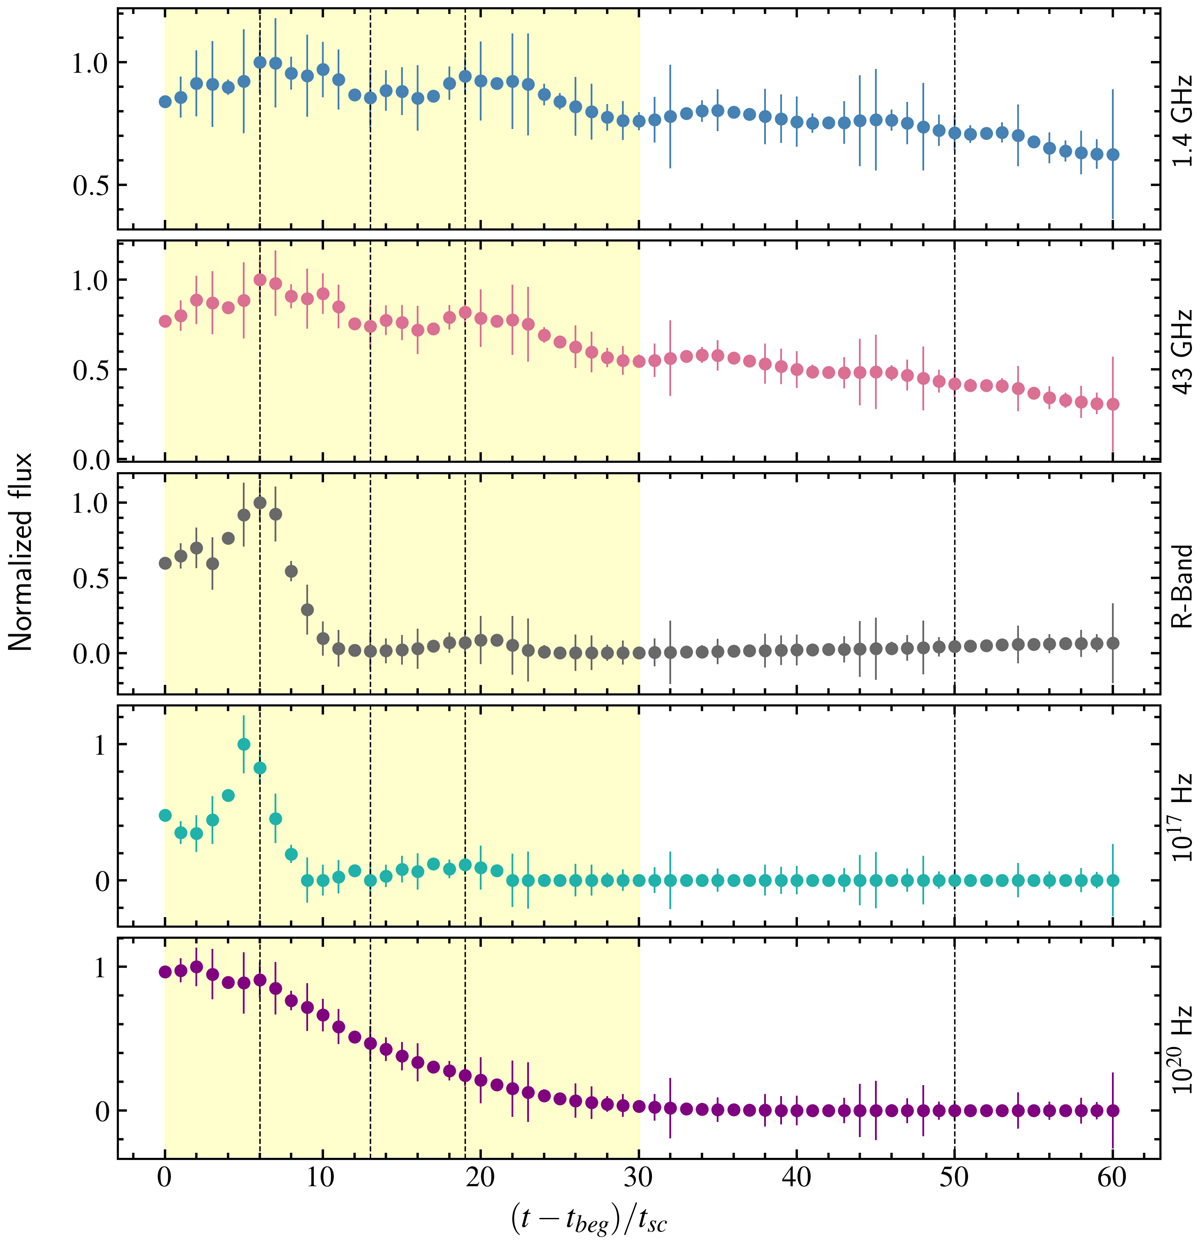
Simulated light curve for the Ref_s10 case for an observer making 5° angle with the axis of the column. The observing frequencies are ν = 1.4 GHz, 43 GHz, 1.4 × 10¹⁴ Hz (R-band), 1017 Hz, and 1020 Hz, respectively, from top to bottom. The vertical black dotted lines and the shaded regions correspond to different activity state of the system (discussed in Sect. 4.2.2). The flux values from top to bottom are normalized to their maximum values 2.64 × 10⁻¹⁷, 2.52 × 10⁻¹⁷, 2.66 × 10⁻²¹, 5.13 × 10⁻²⁴, and 1.54 × 10⁻³¹, respectively, and given in units of ergs s−1 cm−2 Hz−1.
Current usage metrics show cumulative count of Article Views (full-text article views including HTML views, PDF and ePub downloads, according to the available data) and Abstracts Views on Vision4Press platform.
Data correspond to usage on the plateform after 2015. The current usage metrics is available 48-96 hours after online publication and is updated daily on week days.
Initial download of the metrics may take a while.