Fig. 5.
Download original image
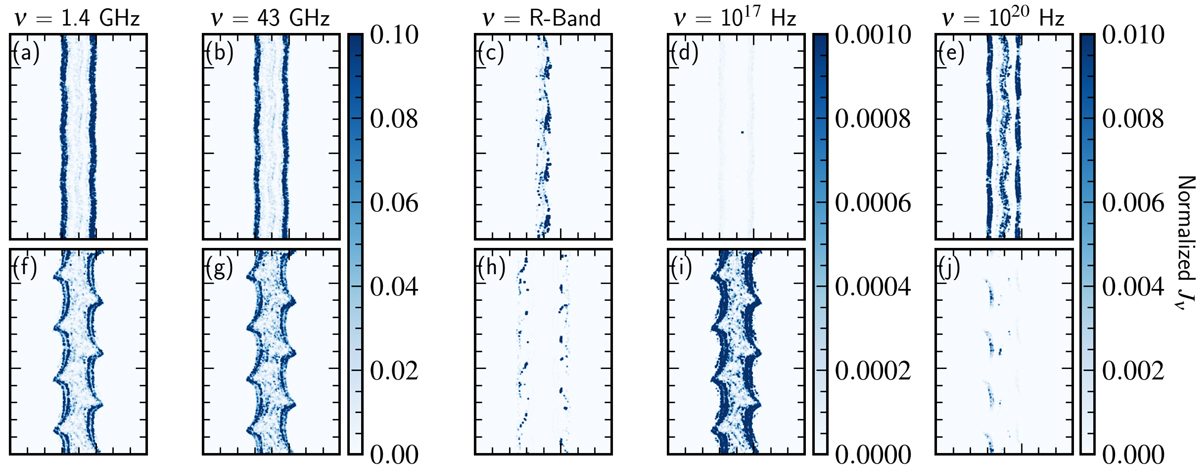
X − Z cuts of emissivity slices for Ref_s10 case at observing frequencies ν = 1.4 GHz (a), 43 GHz (b), R-band (c), 1017 Hz (d) and 1020 Hz (e) at time stamps t/tsc = 26 (top) and 70 (bottom). The emissivity values are normalized to their maximum values and given in the units of erg s−1 cm−3 Hz−1 str−1. The normalized values of 3.42 × 10⁻²², 4.23 × 10⁻²², 3.94 × 10⁻²⁵, 8.31 × 10⁻²⁷, 3.4 × 10⁻³⁵, 2.83 × 10⁻²², 1.74 × 10⁻²², 4.76 × 10⁻²⁶, 6.71 × 10⁻²⁹, and 3.4 × 10−38 for panels a, b, c, d, e, f, g, h, i, and j, respectively.
Current usage metrics show cumulative count of Article Views (full-text article views including HTML views, PDF and ePub downloads, according to the available data) and Abstracts Views on Vision4Press platform.
Data correspond to usage on the plateform after 2015. The current usage metrics is available 48-96 hours after online publication and is updated daily on week days.
Initial download of the metrics may take a while.