Open Access
Fig. A.1.
Download original image
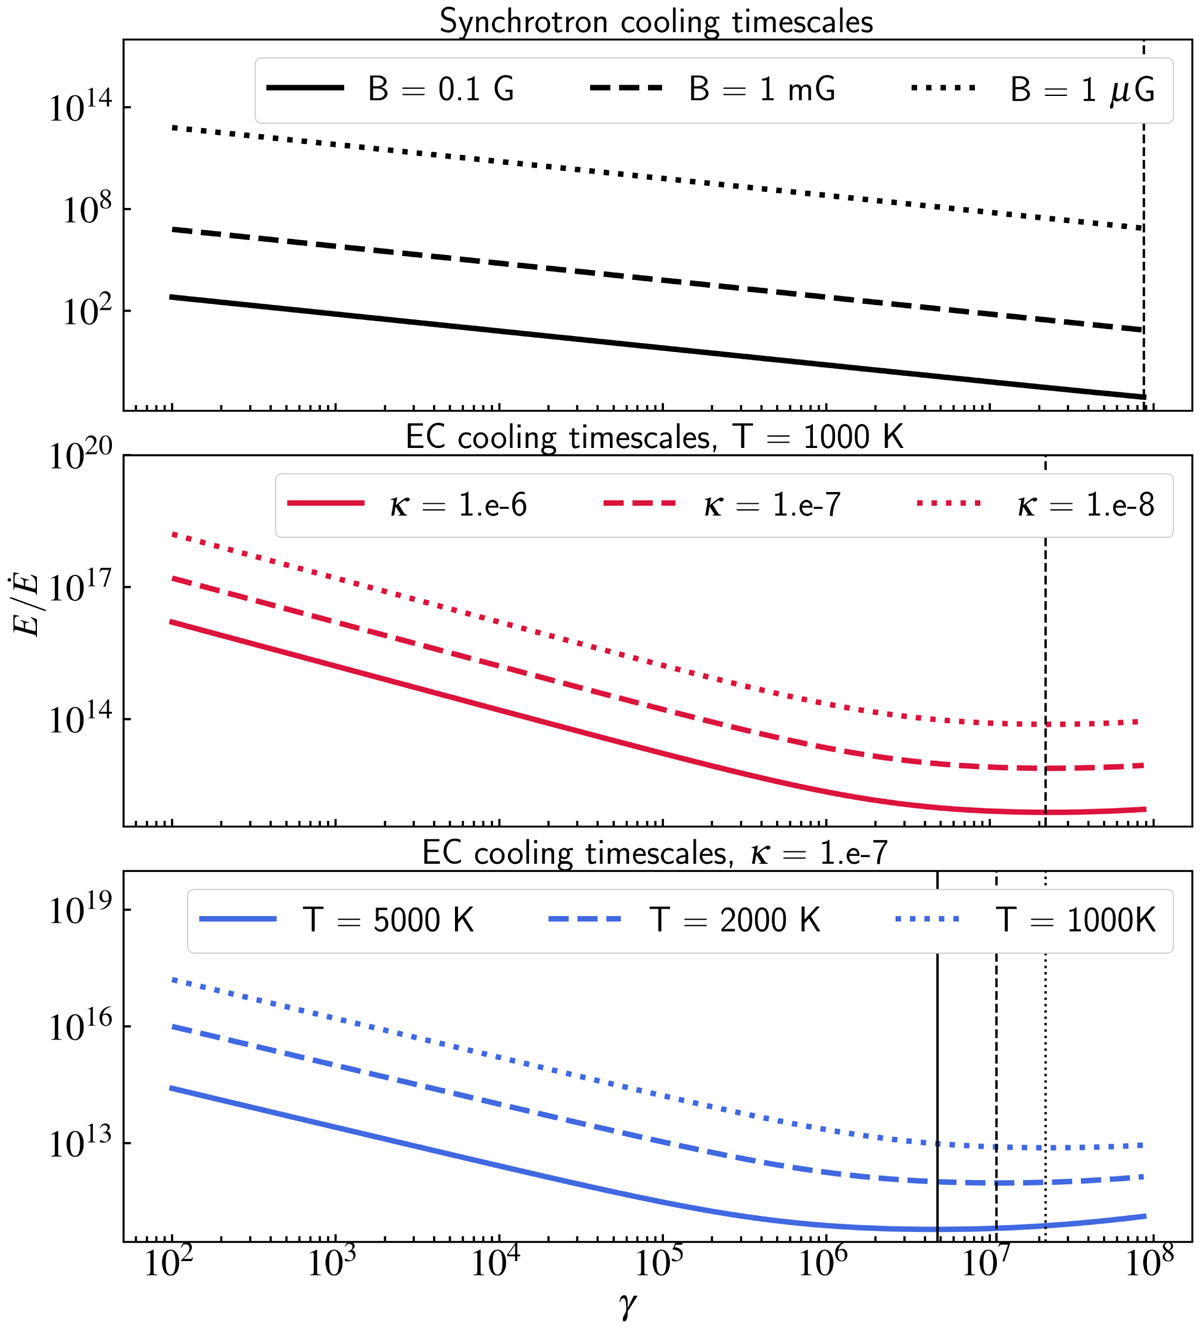
Cooling time scale of the emitting electron for the synchrotron process only (top panel) and EC process only (middle and bottom panels). The black dotted lines indicate the energy for which the cooling time is minimum. The different line styles correspond to different parameters as stated in the plot.
Current usage metrics show cumulative count of Article Views (full-text article views including HTML views, PDF and ePub downloads, according to the available data) and Abstracts Views on Vision4Press platform.
Data correspond to usage on the plateform after 2015. The current usage metrics is available 48-96 hours after online publication and is updated daily on week days.
Initial download of the metrics may take a while.