Fig. 9
Download original image
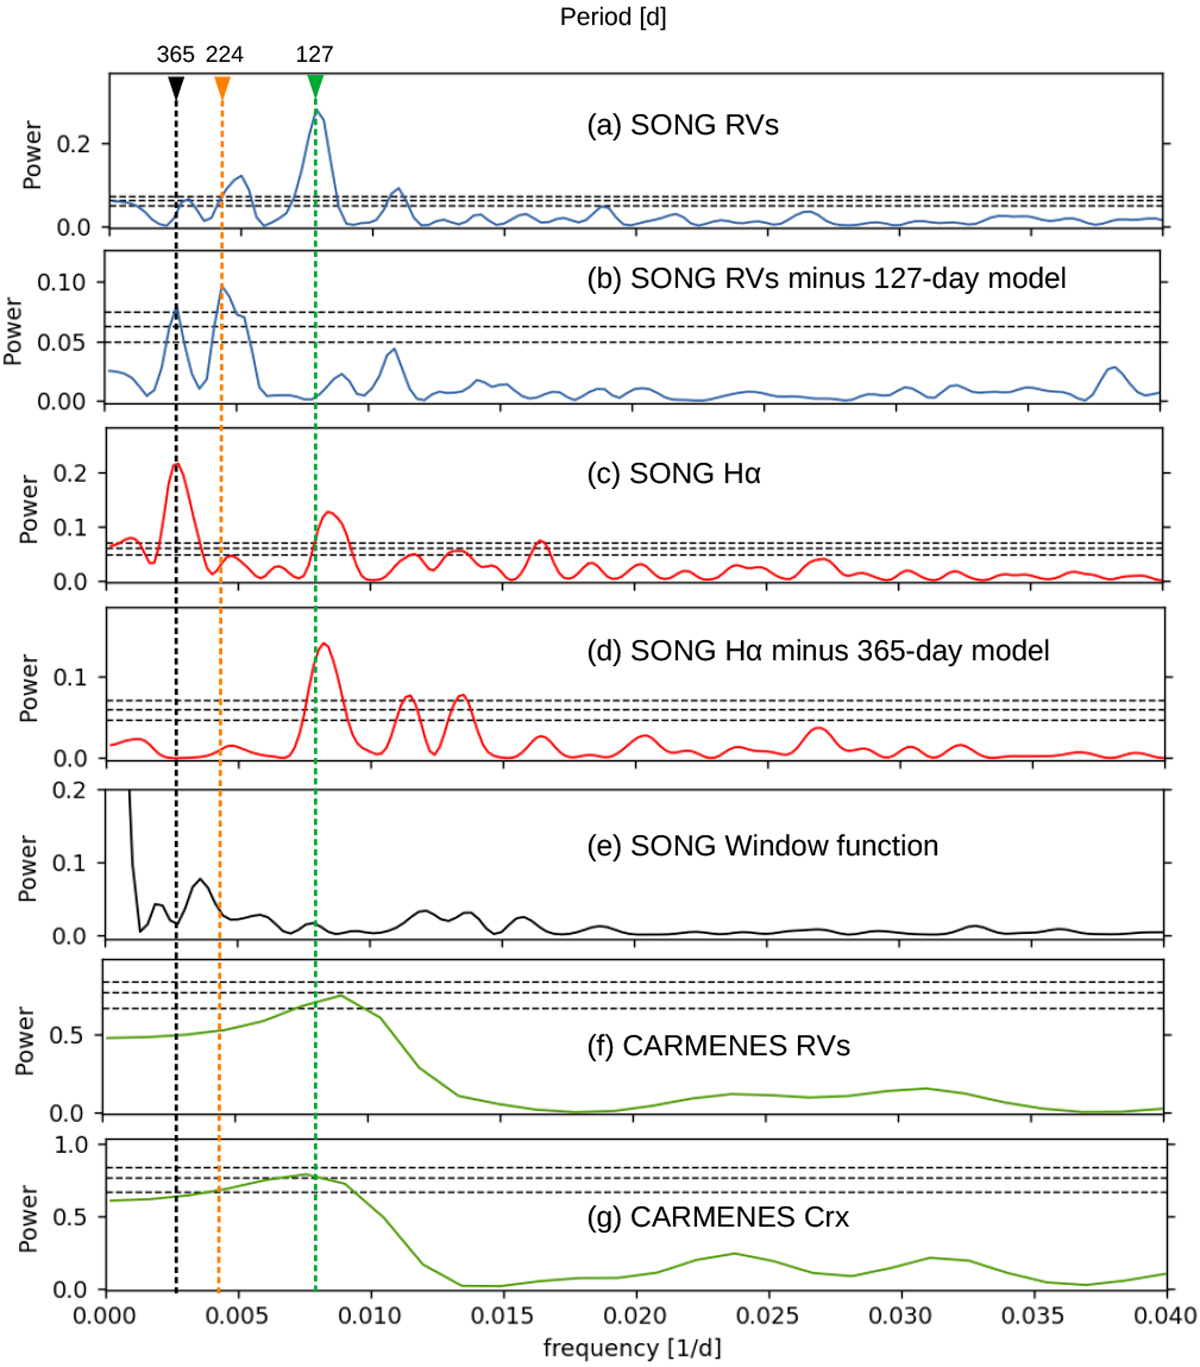
GLS periodograms oſ SONG RVs (blue) and activity indicators (red) and CARMENES RVs and CRX (green) of HD 46588: (a) SONG RVs, (b) SONG RVs after removing the model with the period of 127 days, (c) SONG Hα activity indicator, (d) SONG Hα indicator after fitting a sinusoid with P = 365 days, (e) SONG window function, (f) CARMENES RVs, and (g) CARMENES CRX. The vertical green line represents the short-term activity cycle, the orange line represents the possible planetary candidate, and the black line represents the 1-yr window function. Horizontal dashed lines show the theoretical FAP levels of 10%, 1%, and 0.1% for each panel.
Current usage metrics show cumulative count of Article Views (full-text article views including HTML views, PDF and ePub downloads, according to the available data) and Abstracts Views on Vision4Press platform.
Data correspond to usage on the plateform after 2015. The current usage metrics is available 48-96 hours after online publication and is updated daily on week days.
Initial download of the metrics may take a while.