Open Access
Fig. 6
Download original image
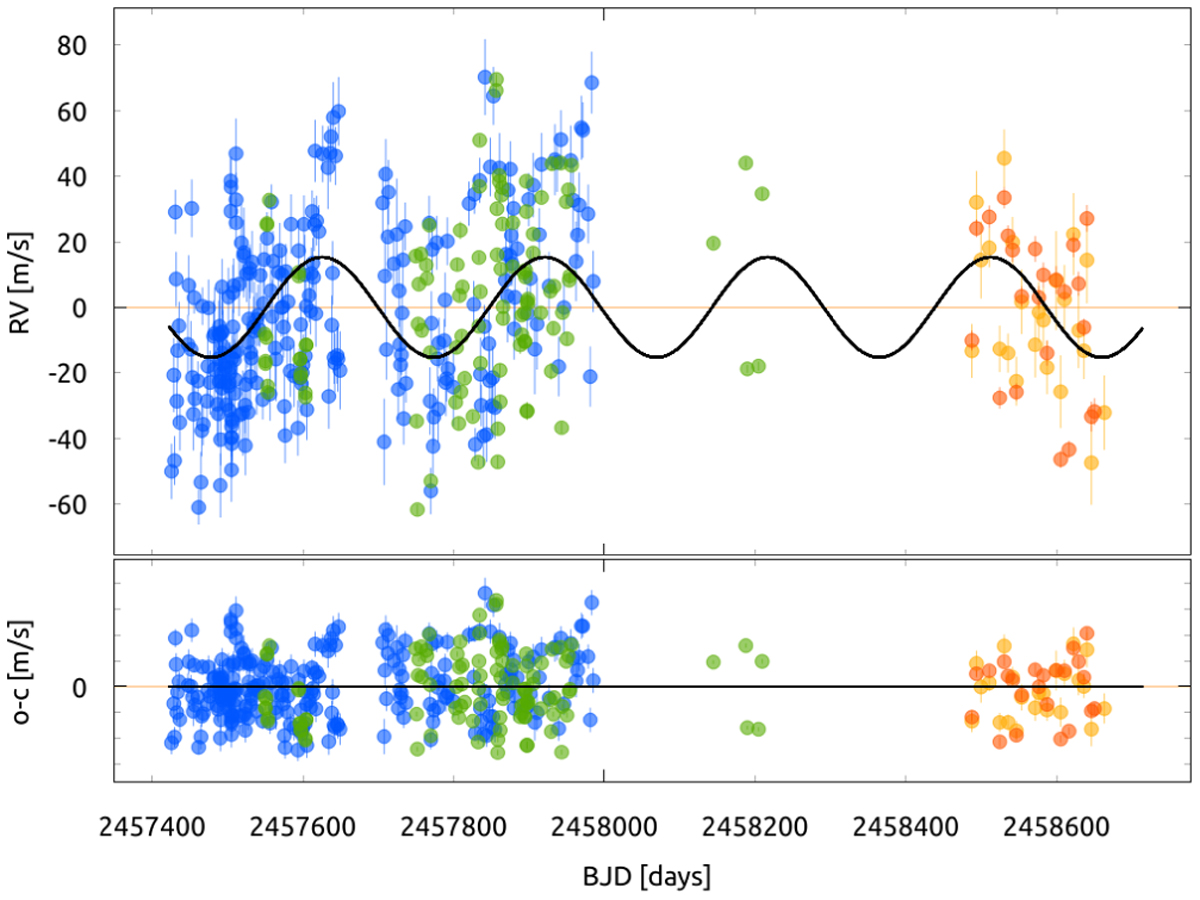
SONG RVs of GJ504 (blue), HARPS-N RVs (green), and CARMENES RVs (orange) together with the inferred RV model of the 292.74-day signal (solid black line). The nominal error bars are in blue and red and are hardly visible for the HARPS-N dataset. Bottom panel: Residuals of the RV model.
Current usage metrics show cumulative count of Article Views (full-text article views including HTML views, PDF and ePub downloads, according to the available data) and Abstracts Views on Vision4Press platform.
Data correspond to usage on the plateform after 2015. The current usage metrics is available 48-96 hours after online publication and is updated daily on week days.
Initial download of the metrics may take a while.