Fig. 2
Download original image
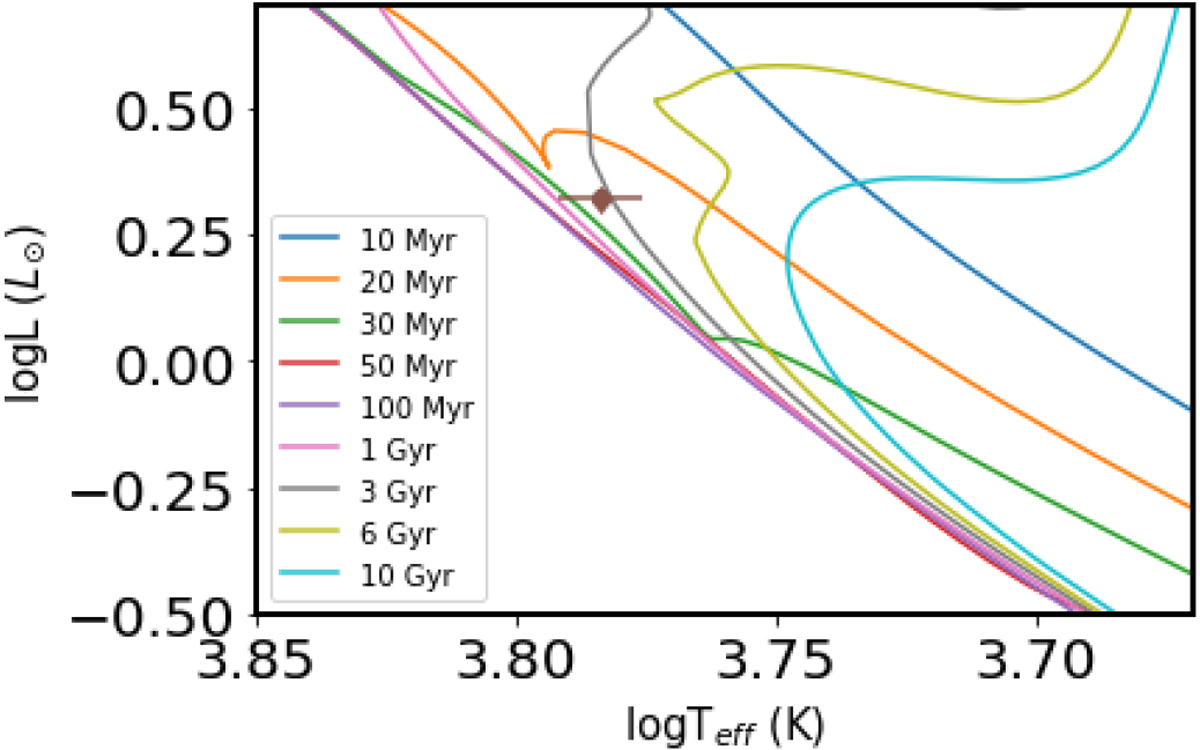
Luminosity versus effective temperature plot. Curves represent MIST isochrones for ages: 10 Myr (blue), 20 Myr (orange), 30 Myr (green), 50 Myr (red), 100 Myr (purple), 1 Gyr (pink), 3 Gyr (grey), 6Gyr (chartreuse), and 10 Gyr (celeste), and for [Fe/H] = 0.25. The brown point represents the parameters of GJ 504 with their error bars.
Current usage metrics show cumulative count of Article Views (full-text article views including HTML views, PDF and ePub downloads, according to the available data) and Abstracts Views on Vision4Press platform.
Data correspond to usage on the plateform after 2015. The current usage metrics is available 48-96 hours after online publication and is updated daily on week days.
Initial download of the metrics may take a while.