Fig. 9.
Download original image
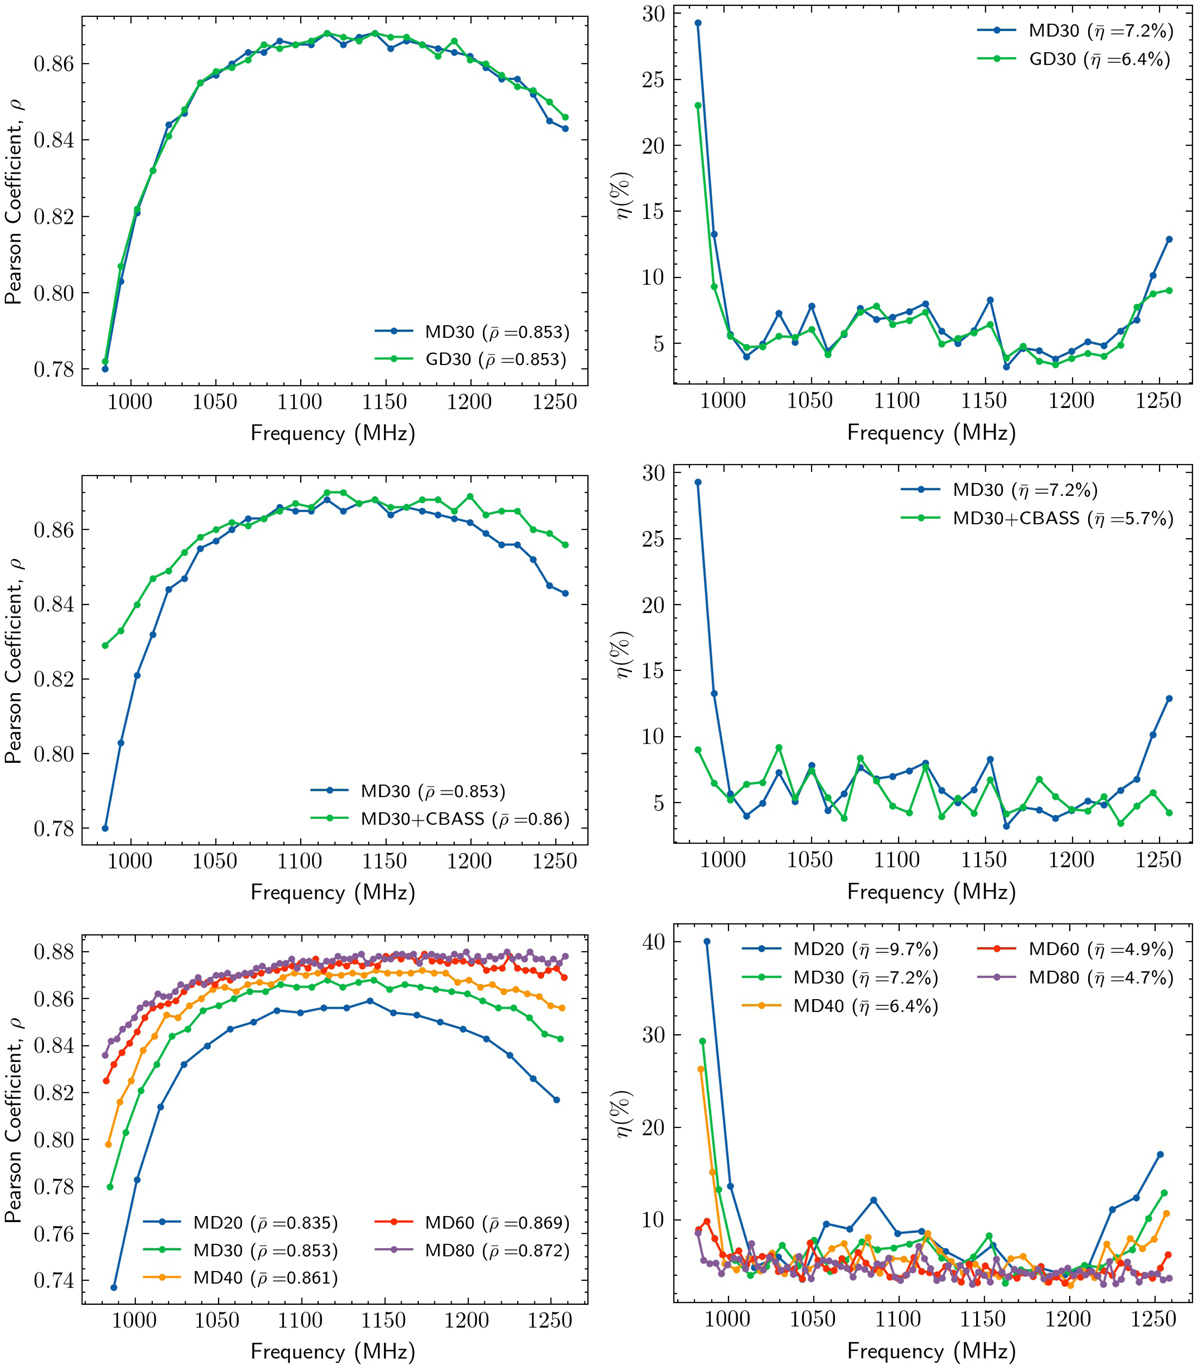
Left column: Pearson coefficient ρ calculated for each pair of expected and reconstructed 21 cm plus thermal noise maps. The ![]() value in parentheses is the average correlation calculated over all frequency channels. Right column: reconstruction error of the 21 cm signal power spectrum η calculated as an average over the multipole range 30 ≤ ℓ ≤ 270, on each frequency channel. The value
value in parentheses is the average correlation calculated over all frequency channels. Right column: reconstruction error of the 21 cm signal power spectrum η calculated as an average over the multipole range 30 ≤ ℓ ≤ 270, on each frequency channel. The value ![]() in parentheses is the average error calculated over all frequency channels. Top row: comparison between the results of ρ and ν for the MD30 and GD30 configurations (different synchrotron models). Center row: comparison between the results of ρ and ν for the MD30 and MD30+CBASS configurations (inclusion of an independent foreground observation). Bottom row: comparison between the results of ρ and ν for the MD20, MD30, MD40, MD60, and MD80 configurations (different numbers of frequency bins).
in parentheses is the average error calculated over all frequency channels. Top row: comparison between the results of ρ and ν for the MD30 and GD30 configurations (different synchrotron models). Center row: comparison between the results of ρ and ν for the MD30 and MD30+CBASS configurations (inclusion of an independent foreground observation). Bottom row: comparison between the results of ρ and ν for the MD20, MD30, MD40, MD60, and MD80 configurations (different numbers of frequency bins).
Current usage metrics show cumulative count of Article Views (full-text article views including HTML views, PDF and ePub downloads, according to the available data) and Abstracts Views on Vision4Press platform.
Data correspond to usage on the plateform after 2015. The current usage metrics is available 48-96 hours after online publication and is updated daily on week days.
Initial download of the metrics may take a while.