Fig. 7.
Download original image
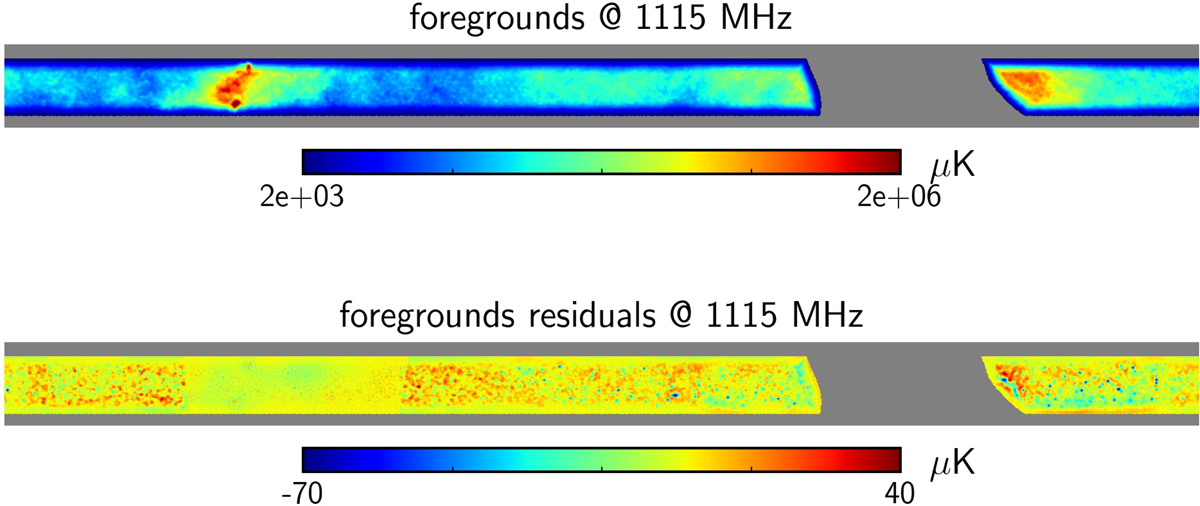
Map containing the sum of all foregrounds described in Sect. 3.1 (top) and their respective residuals after GNILC (bottom) at 1115 MHz in the MD30 configuration (see Table 1). The maps are in celestial coordinates and are covered with the apodized Galactic mask defined in Sect. 3.2. We note the region of extreme declination where the signal is attenuated by the apodized mask.
Current usage metrics show cumulative count of Article Views (full-text article views including HTML views, PDF and ePub downloads, according to the available data) and Abstracts Views on Vision4Press platform.
Data correspond to usage on the plateform after 2015. The current usage metrics is available 48-96 hours after online publication and is updated daily on week days.
Initial download of the metrics may take a while.