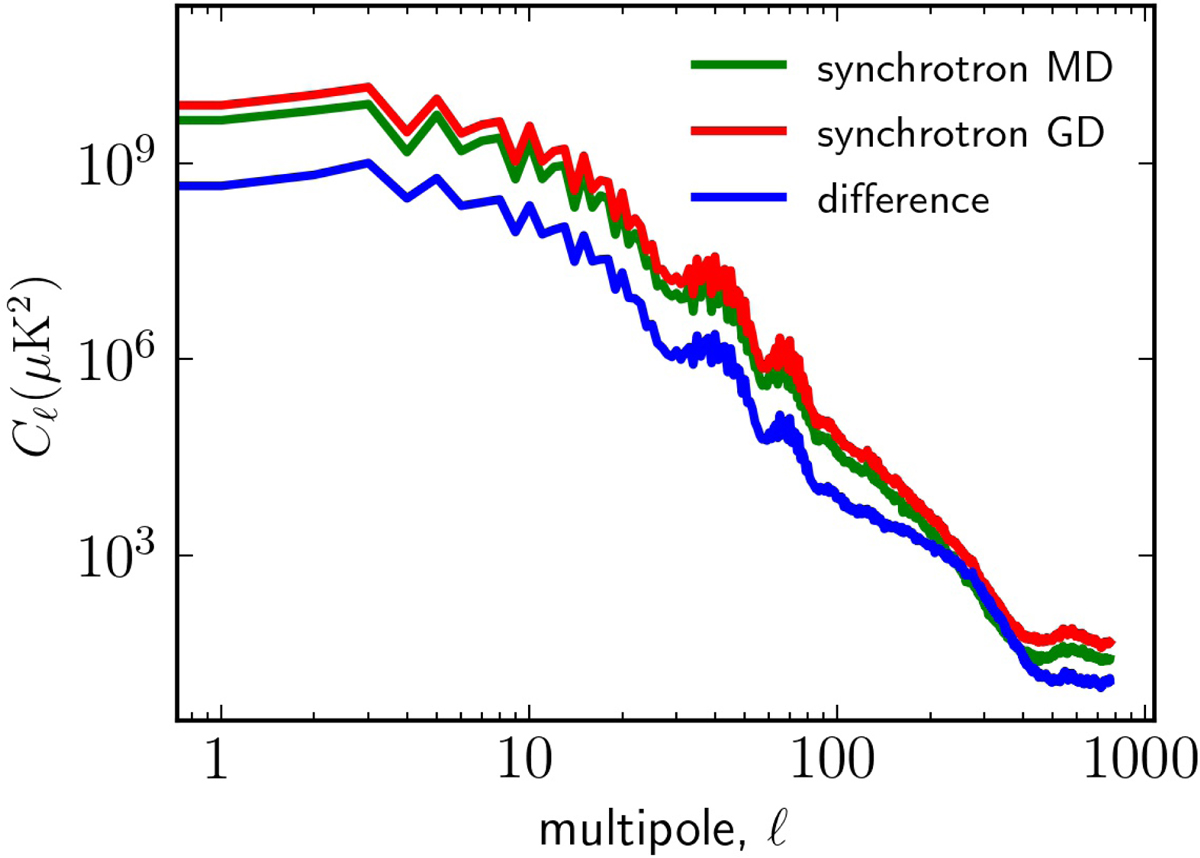
Fig. 2.
Download original image
Power spectra referring to the MD (green) and GD (red) synchrotron maps shown in Fig. 1, as well as the power spectrum calculated from the difference between them (blue), defined in the frequency channel centered at 1115 MHz and with a bandwidth of δν ∼ 9.33 MHz (30 channels configuration). The maps were convolved with a FWHM = 40 arcmin beam. The observed region corresponds to the area covered by BINGO with the apodized Galactic mask defined in Sect. 3.2.
Current usage metrics show cumulative count of Article Views (full-text article views including HTML views, PDF and ePub downloads, according to the available data) and Abstracts Views on Vision4Press platform.
Data correspond to usage on the plateform after 2015. The current usage metrics is available 48-96 hours after online publication and is updated daily on week days.
Initial download of the metrics may take a while.