Fig. 11.
Download original image
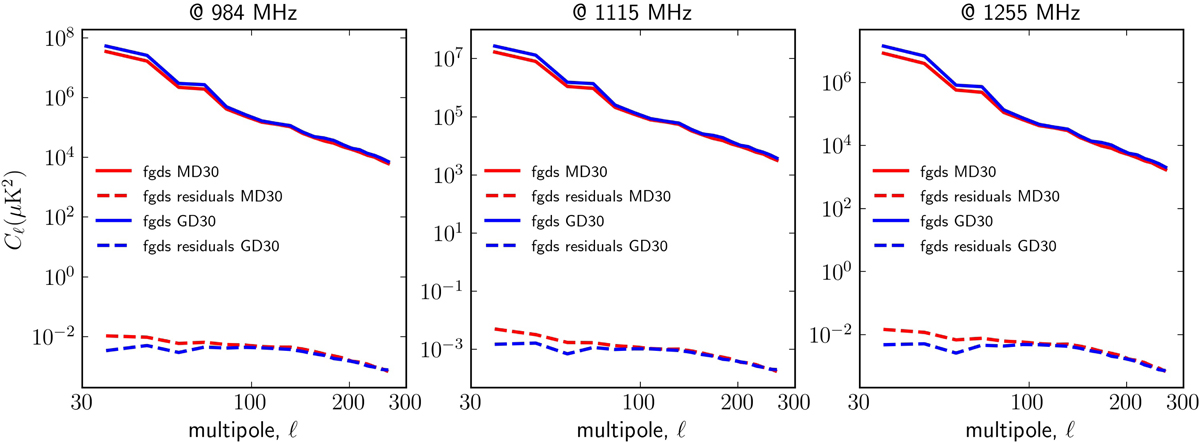
Power spectra of foreground emission in MD30 (red) and GD30 (blue) configurations, as well as their respective residuals present in the signal reconstructed with the GNILC (dashed red and dashed blue). The power spectra are plotted for frequency channels centered at 0.985 GHz (left), 1.115 GHz (center), and 1.255 GHz (right). The multipole range considered is 30 ≤ ℓ ≤ 270, with a multipole bin size of Δℓ = 12.
Current usage metrics show cumulative count of Article Views (full-text article views including HTML views, PDF and ePub downloads, according to the available data) and Abstracts Views on Vision4Press platform.
Data correspond to usage on the plateform after 2015. The current usage metrics is available 48-96 hours after online publication and is updated daily on week days.
Initial download of the metrics may take a while.