Fig. 10.
Download original image
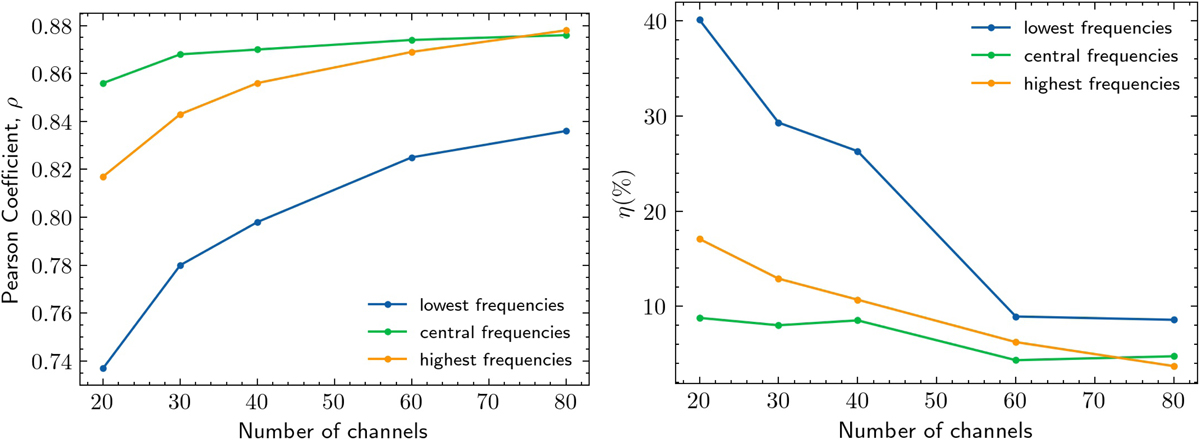
Left: Pearson coefficients calculated for each pair of expected and reconstructed HI plus thermal noise maps. Right: 21 cm power spectrum reconstruction error, calculated as an average over the multipole range 30 ≤ ℓ ≤ 270. Both parameters are calculated for simulated data with a different number of channels (MD20, MD30, MD40, MD60 and MD80 configurations), in channels centered at three different frequency channels: lowest frequencies (channels centered on 987, 984.7, 983.5, 982.3, and 981.7 MHz), central frequencies (channels centered on 1113, 1115.3, 1116.5, 1117.7, and 1118.2 MHz), and highest frequencies (channels centered on 1253, 1255.3, 1256.5, 1257.7, and 1258.2 MHz).
Current usage metrics show cumulative count of Article Views (full-text article views including HTML views, PDF and ePub downloads, according to the available data) and Abstracts Views on Vision4Press platform.
Data correspond to usage on the plateform after 2015. The current usage metrics is available 48-96 hours after online publication and is updated daily on week days.
Initial download of the metrics may take a while.