Fig. 7.
Download original image
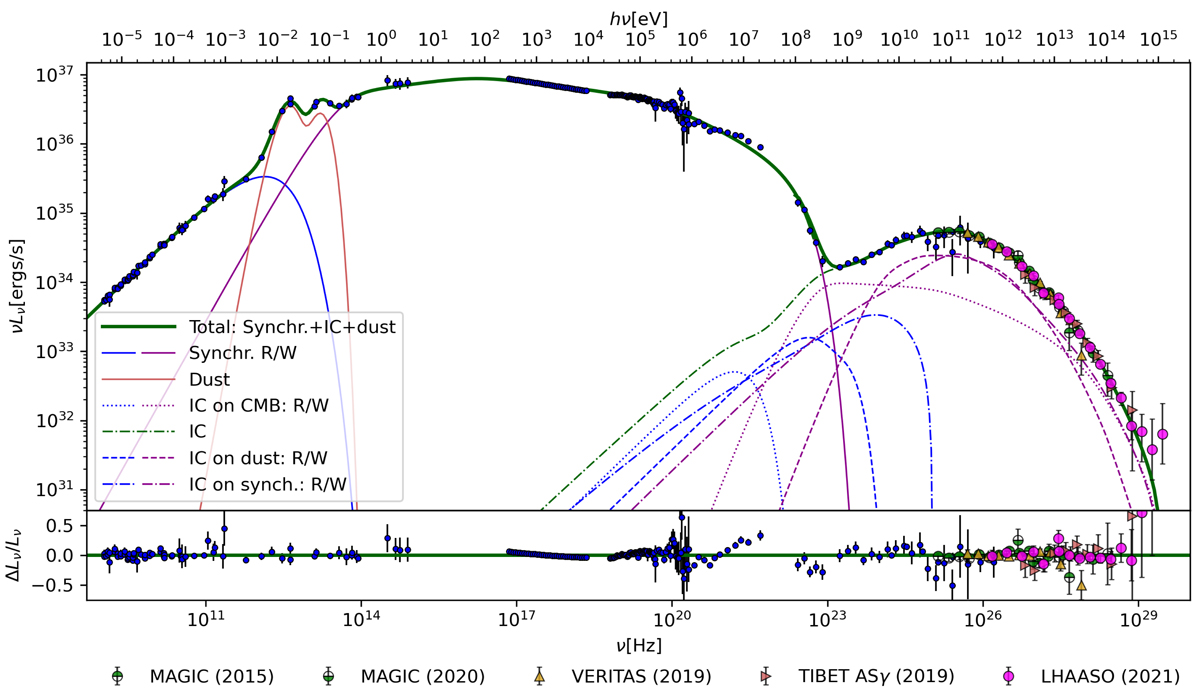
Best-fitting model in comparison to the data. The upper plot shows the synchrotron and inverse Compton (IC) radiation by radio (R) and wind (W) electrons produced in the spatially varying magnetic field and seed photon field (blue and magenta coloured broken lines indicate the contributions from IC scattering on individual seed photon fields). The blue data points are used in the fit to determine the parameters ![]() listed in Table 4. The VHE data have been scaled using the values of ζi determined for each data-set (see text for further details) to adjust the energy scale for prediction given by the global minimum
listed in Table 4. The VHE data have been scaled using the values of ζi determined for each data-set (see text for further details) to adjust the energy scale for prediction given by the global minimum ![]() . In the lower plot, the relative residuals are shown (statistical uncertainties only).
. In the lower plot, the relative residuals are shown (statistical uncertainties only).
Current usage metrics show cumulative count of Article Views (full-text article views including HTML views, PDF and ePub downloads, according to the available data) and Abstracts Views on Vision4Press platform.
Data correspond to usage on the plateform after 2015. The current usage metrics is available 48-96 hours after online publication and is updated daily on week days.
Initial download of the metrics may take a while.