Fig. 5.
Download original image
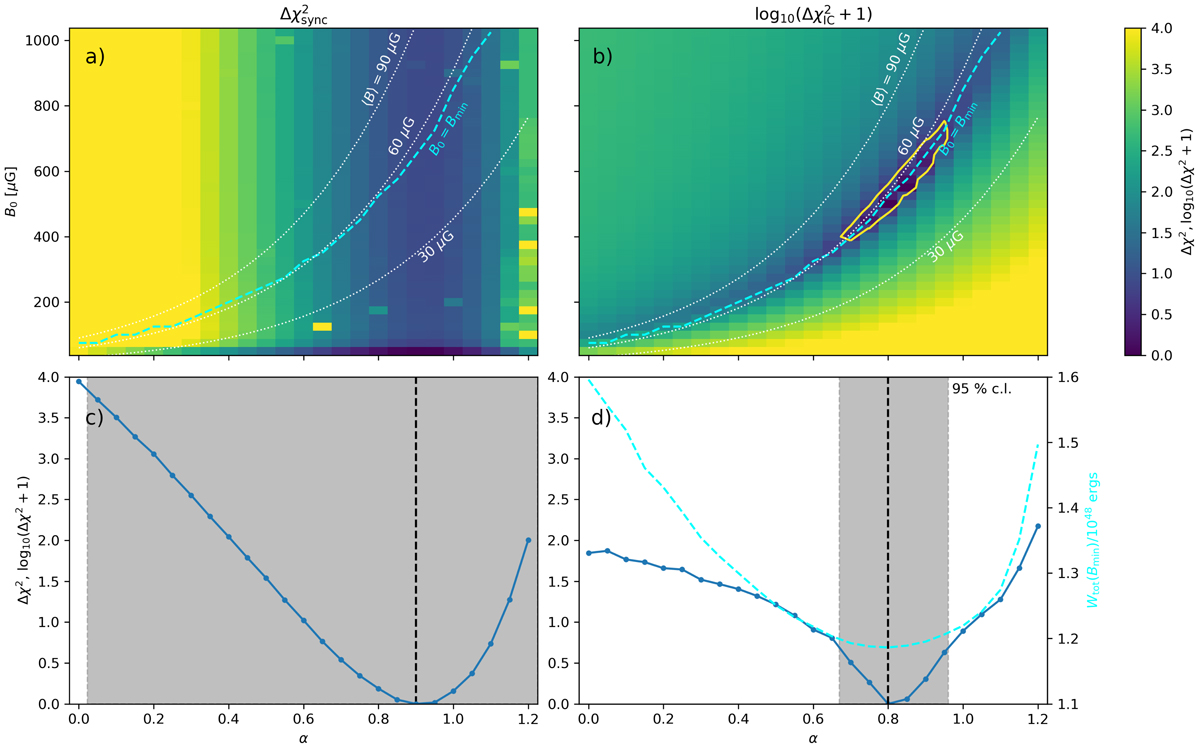
Results of the fitting procedure. Left column: (a) ![]() and (c)
and (c) ![]() . Right column: (b)
. Right column: (b) ![]() and (d)
and (d) ![]() . In the top panels, for each combination of α, B0, the other parameters of the model are marginalised; in the bottom panels, this includes B0. The dotted white lines in the top panels indicate the contours for constant values of volume averaged ⟨B⟩ = 30, 60, 90 μG. The cyan dashed line indicates the combinations B0 and α with the minimum total energy Wtot in electrons and magnetic field. The yellow solid contour marks the 95% confidence level error box for B0, α. The grey boxes in the bottom panel indicate the 95% confidence interval for α. In the bottom right diagram, the cyan dashed line indicates the minimal total energy Wtot for a given α. For a discussion on the relevance of the co-location of the global minimum
. In the top panels, for each combination of α, B0, the other parameters of the model are marginalised; in the bottom panels, this includes B0. The dotted white lines in the top panels indicate the contours for constant values of volume averaged ⟨B⟩ = 30, 60, 90 μG. The cyan dashed line indicates the combinations B0 and α with the minimum total energy Wtot in electrons and magnetic field. The yellow solid contour marks the 95% confidence level error box for B0, α. The grey boxes in the bottom panel indicate the 95% confidence interval for α. In the bottom right diagram, the cyan dashed line indicates the minimal total energy Wtot for a given α. For a discussion on the relevance of the co-location of the global minimum ![]() with the corresponding global minimum of Wtot, see the text.
with the corresponding global minimum of Wtot, see the text.
Current usage metrics show cumulative count of Article Views (full-text article views including HTML views, PDF and ePub downloads, according to the available data) and Abstracts Views on Vision4Press platform.
Data correspond to usage on the plateform after 2015. The current usage metrics is available 48-96 hours after online publication and is updated daily on week days.
Initial download of the metrics may take a while.