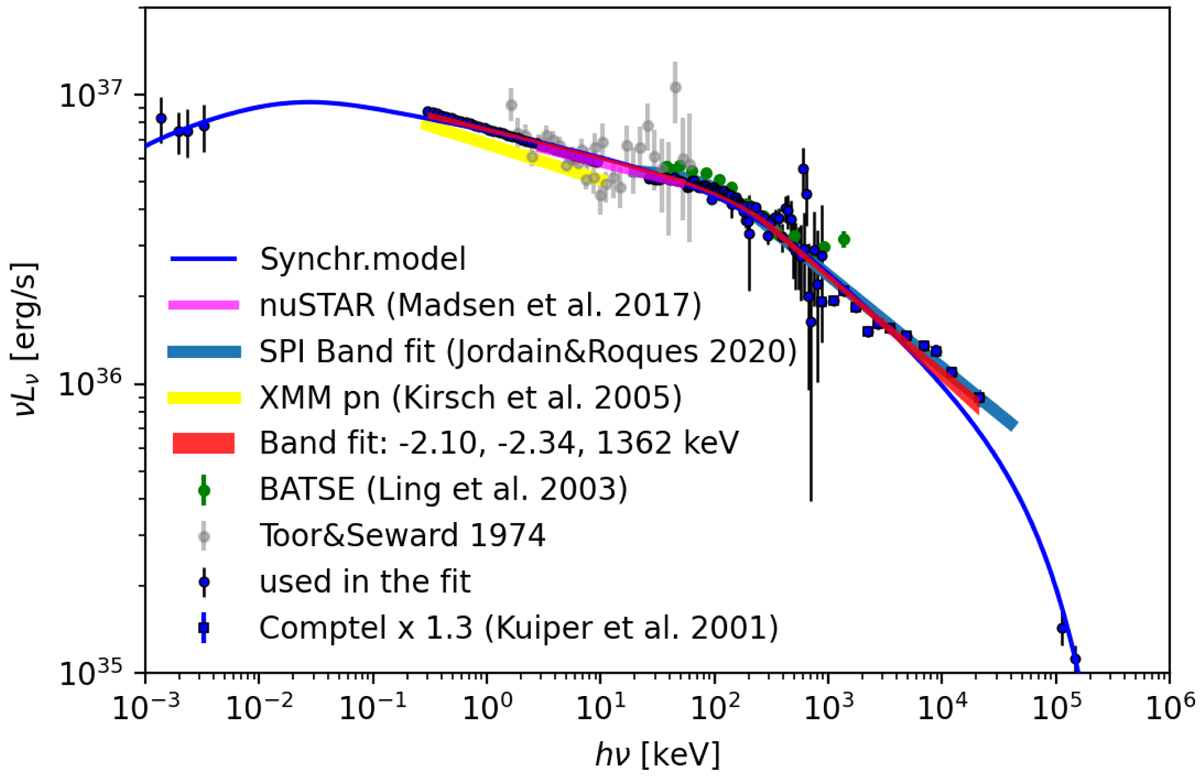
Fig. 3.
Download original image
SED of the Crab Nebula centred on the X-ray energy range. The best-fitting model (blue line, see details on the fitting procedure in Sect. 4 and Table 4) is shown along with measurements from different X-ray observatories. The normalisation of the spectrum measured with XMM-Newton (yellow band) has been scaled up by 16% to be consistent with the absolute flux measurement with NuSTAR (magenta band). The COMPTEL gamma-ray flux has been scaled up by 30% to match the extrapolation of the SPI spectrum.
Current usage metrics show cumulative count of Article Views (full-text article views including HTML views, PDF and ePub downloads, according to the available data) and Abstracts Views on Vision4Press platform.
Data correspond to usage on the plateform after 2015. The current usage metrics is available 48-96 hours after online publication and is updated daily on week days.
Initial download of the metrics may take a while.