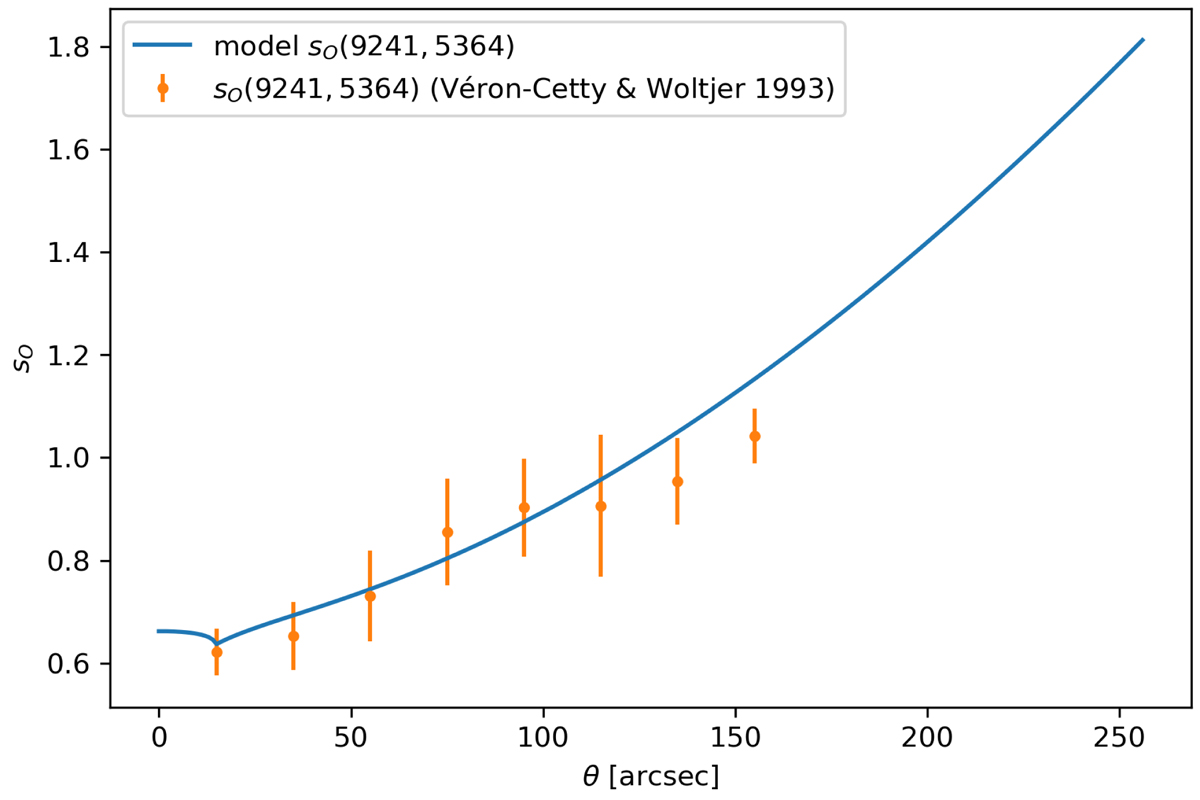
Fig. 2.
Download original image
Predicted and observed optical spectra of the Crab Nebula. In concentric annuli, the mean and root mean square of the spectral indices sO (Iν ∝ ν−sO) have been determined from the data displayed in Fig. 1 of Véron-Cetty & Woltjer (1993). The superimposed curve is calculated from the intensity expected from the synchrotron model as described in Sect. 4.3 with the best-fitting parameters listed in Table 4. It is important to note that these data have not been used in the fit.
Current usage metrics show cumulative count of Article Views (full-text article views including HTML views, PDF and ePub downloads, according to the available data) and Abstracts Views on Vision4Press platform.
Data correspond to usage on the plateform after 2015. The current usage metrics is available 48-96 hours after online publication and is updated daily on week days.
Initial download of the metrics may take a while.