Fig. 10.
Download original image
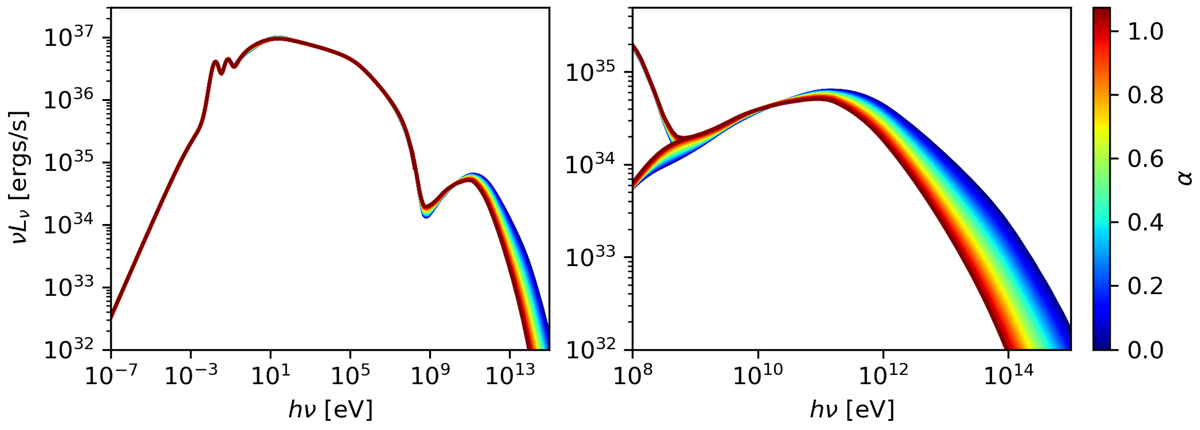
Overall spectral energy distribution for the estimated best-fitting parameters ![]() (after minimising
(after minimising ![]() for fixed values of α) is shown. The value of α characterises the radial decrease of the magnetic field B ∝ r−α (see Eq. (14)). While the synchrotron part of the spectral energy distribution is almost degenerate with respect to the choice of α, the inverse Compton dominated part (right panel) shows noticeable differences up to the peak at approximately 1011 eV. Note, in the left panel the sum of synchrotron and inverse Compton emission is shown, while in the right panel, the SED of the inverse Compton emission is additionally superimposed.
for fixed values of α) is shown. The value of α characterises the radial decrease of the magnetic field B ∝ r−α (see Eq. (14)). While the synchrotron part of the spectral energy distribution is almost degenerate with respect to the choice of α, the inverse Compton dominated part (right panel) shows noticeable differences up to the peak at approximately 1011 eV. Note, in the left panel the sum of synchrotron and inverse Compton emission is shown, while in the right panel, the SED of the inverse Compton emission is additionally superimposed.
Current usage metrics show cumulative count of Article Views (full-text article views including HTML views, PDF and ePub downloads, according to the available data) and Abstracts Views on Vision4Press platform.
Data correspond to usage on the plateform after 2015. The current usage metrics is available 48-96 hours after online publication and is updated daily on week days.
Initial download of the metrics may take a while.