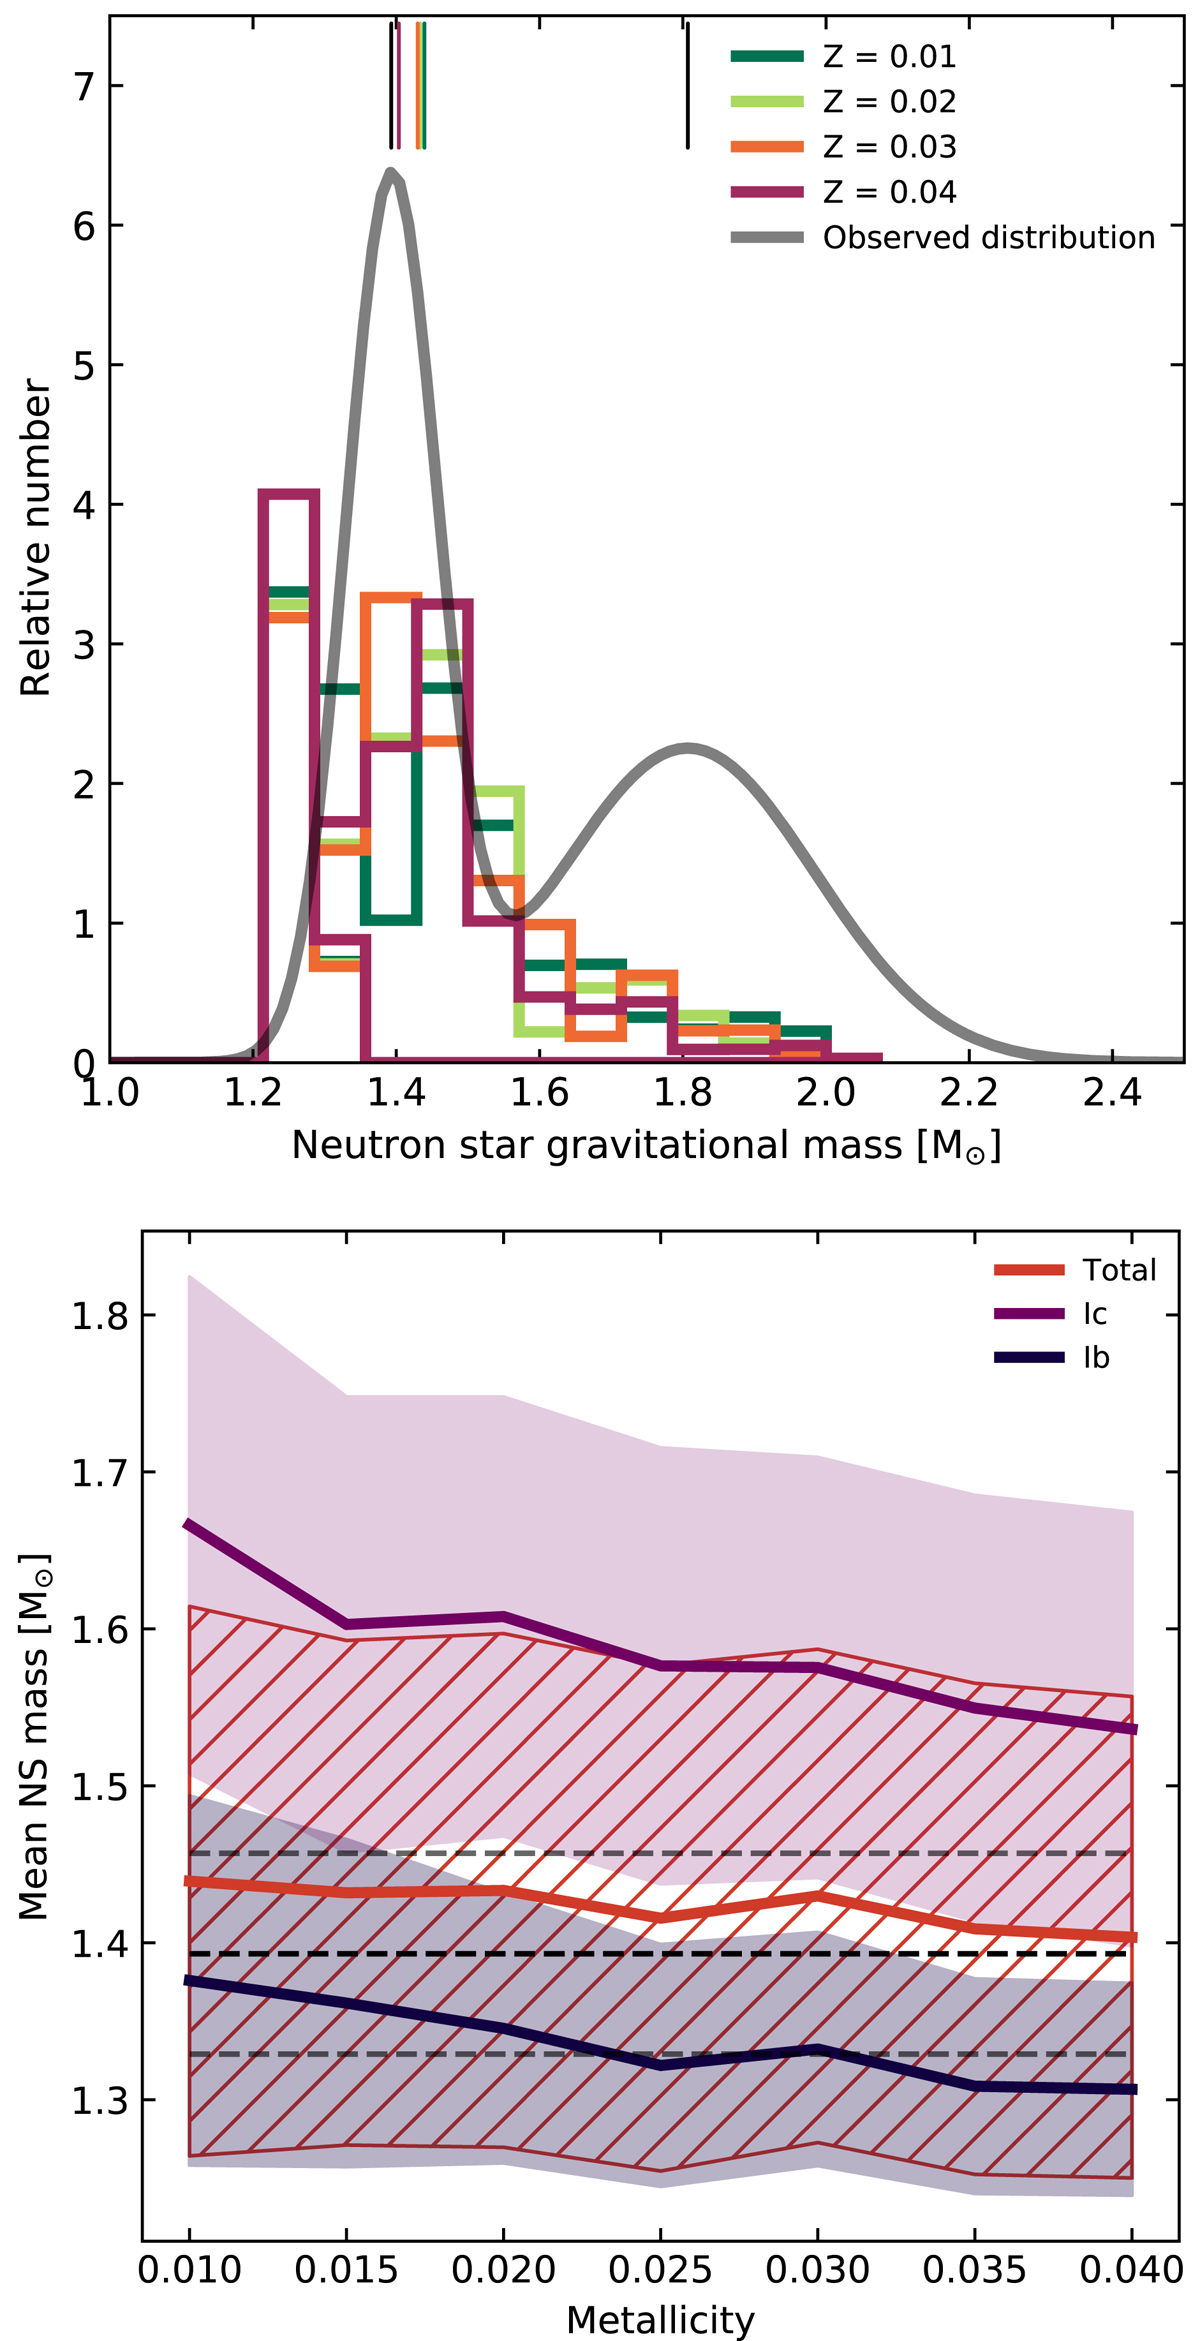
Fig. 9.
Download original image
Properties of NS gravitational mass distribution in different metallicities. Top: distribution of NS gravitational masses that result from analysing our core-collapse models with the Mandel & Müller (2020) model, weighted by the IMF from Salpeter (1955), compared to the observed distribution inferred by Antoniadis et al. (2016). The average values of the distributions are represented by vertical lines at the top of the figure. The lowest-mass NSs correspond to progenitors outside of our model grid, and their resulting mass has been assumed to be between 1.22 and 1.3 M⊙. Bottom: Mean value (solid lines) and standard deviation (hatched, shaded regions) of the total distributions and the distributions separated by SN type. The mean value (dashed black line) and the standard deviation (grey line) of the first NS mass peak of the observed distribution of Antoniadis et al. (2016) is shown for comparison.
Current usage metrics show cumulative count of Article Views (full-text article views including HTML views, PDF and ePub downloads, according to the available data) and Abstracts Views on Vision4Press platform.
Data correspond to usage on the plateform after 2015. The current usage metrics is available 48-96 hours after online publication and is updated daily on week days.
Initial download of the metrics may take a while.