| Issue |
A&A
Volume 671, March 2023
|
|
|---|---|---|
| Article Number | C6 | |
| Number of page(s) | 3 | |
| Section | Galactic structure, stellar clusters and populations | |
| DOI | https://doi.org/10.1051/0004-6361/202243296e | |
| Published online | 09 March 2023 | |
Warp and flare of the Galactic disc revealed with supergiants by Gaia EDR3 (Corrigendum)
1
Instituto de Astrofísica de Canarias, 38205 La Laguna, Tenerife, Spain
e-mail: This email address is being protected from spambots. You need JavaScript enabled to view it.
2
Departamento de Astrofísica, Universidad de La Laguna, 38206 La Laguna, Tenerife, Spain
3
Faculty of Mathematics, Physics, and Informatics, Comenius University, Mlynská dolina, 842 48 Bratislava, Slovakia
Key words: Galaxy: disk / Galaxy: structure / errata, addenda
Equal first authors.
Wrong versions of Figures 6–12 were originally published, due to a file error during the production process. The correct figures are presented here.
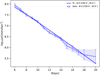 |
Fig. 6. Dependence of the density on the Galactocentric distance in the Galactic equatorial plane for the azimuth ϕ ∈ [330°,30°]. The data points were obtained as weighted mean in bins of size 1 kpc in R and 0.4 kpc in |z|, and were fitted with the model defined in Eq. (16). |
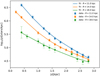 |
Fig. 7. Dependence of the density on |z| for various values of Galactocentric distance. The Galactic azimuth is ϕ ∈ [330°,30°]. The data points were obtained as weighted mean in bins of size 1 kpc in R and 0.2 kpc in |z|. |
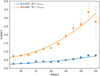 |
Fig. 8. Dependence of the scale height of the thick and the thin discs on the Galactocentric distance. The Galactic azimuth is ϕ ∈ [330°,30°]. The dashed line is the second-order polynomial fit to the data points. |
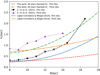 |
Fig. 9. Comparison of the flare for the whole population (Sample 0) with other works. Our work is represented by the polynomial fits to the scale height data points (for more details and data points with error bars, see Table 2 and Fig. 8). |
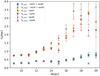 |
Fig. 10. Dependence of the scale height of the thick and the thin discs on the Galactocentric distance. The Galactic azimuth is ϕ ∈ [330°,30°]. The northern, the southern, and the northern+southern flares are compared. |
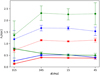 |
Fig. 11. Dependence of the scale height on the Galactic azimuth ϕ for various Galactocentric distances: R = 13 kpc (red lines); R = 15 kpc (blue lines); R = 17 kpc (green lines). Dotted lines represent the scale height of the thick disc and solid lines represent the scale height of the thin disc. Azimuth is binned with size Δϕ = 30°. |
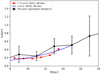 |
Fig. 12. Comparison of the thin disc scale heights of the supergiants (Sample 2) with other works. |
© The Authors 2023
 Open Access article, published by EDP Sciences, under the terms of the Creative Commons Attribution License (https://creativecommons.org/licenses/by/4.0), which permits unrestricted use, distribution, and reproduction in any medium, provided the original work is properly cited.
This article is published in open access under the Subscribe to Open model. This email address is being protected from spambots. You need JavaScript enabled to view it. to support open access publication.
All Figures
|
Fig. 6. Dependence of the density on the Galactocentric distance in the Galactic equatorial plane for the azimuth ϕ ∈ [330°,30°]. The data points were obtained as weighted mean in bins of size 1 kpc in R and 0.4 kpc in |z|, and were fitted with the model defined in Eq. (16). |
| In the text | |
|
Fig. 7. Dependence of the density on |z| for various values of Galactocentric distance. The Galactic azimuth is ϕ ∈ [330°,30°]. The data points were obtained as weighted mean in bins of size 1 kpc in R and 0.2 kpc in |z|. |
| In the text | |
|
Fig. 8. Dependence of the scale height of the thick and the thin discs on the Galactocentric distance. The Galactic azimuth is ϕ ∈ [330°,30°]. The dashed line is the second-order polynomial fit to the data points. |
| In the text | |
|
Fig. 9. Comparison of the flare for the whole population (Sample 0) with other works. Our work is represented by the polynomial fits to the scale height data points (for more details and data points with error bars, see Table 2 and Fig. 8). |
| In the text | |
|
Fig. 10. Dependence of the scale height of the thick and the thin discs on the Galactocentric distance. The Galactic azimuth is ϕ ∈ [330°,30°]. The northern, the southern, and the northern+southern flares are compared. |
| In the text | |
|
Fig. 11. Dependence of the scale height on the Galactic azimuth ϕ for various Galactocentric distances: R = 13 kpc (red lines); R = 15 kpc (blue lines); R = 17 kpc (green lines). Dotted lines represent the scale height of the thick disc and solid lines represent the scale height of the thin disc. Azimuth is binned with size Δϕ = 30°. |
| In the text | |
|
Fig. 12. Comparison of the thin disc scale heights of the supergiants (Sample 2) with other works. |
| In the text | |
Current usage metrics show cumulative count of Article Views (full-text article views including HTML views, PDF and ePub downloads, according to the available data) and Abstracts Views on Vision4Press platform.
Data correspond to usage on the plateform after 2015. The current usage metrics is available 48-96 hours after online publication and is updated daily on week days.
Initial download of the metrics may take a while.