Fig. 9
Download original image
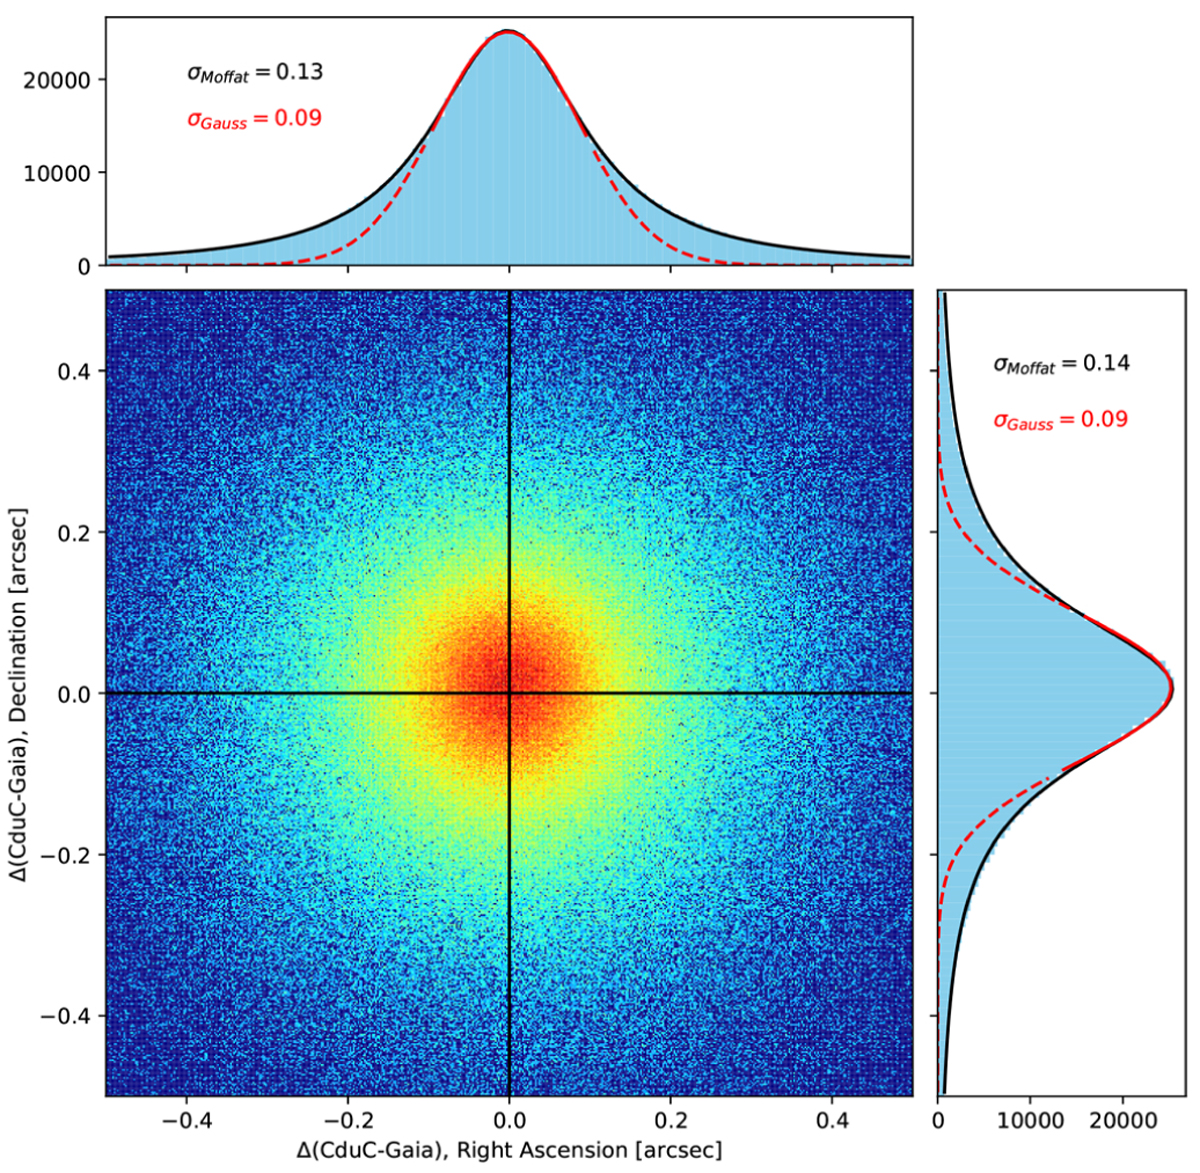
Scatter plot for the coordinate differences between CduC and Gaia EDR3, for the single-exposure plates. The plot is limited to values between [−0.5″, 0.5″]. The histograms show the distributions along RA and Dec. The black line shows a fitted Moffat function. The solid red line shows a Gaussian function fitted to the core of the distribution, while the dashed red line shows the Gaussian function outside the core used for the fit. The widths of the Moffat and Gaussian functions are given.
Current usage metrics show cumulative count of Article Views (full-text article views including HTML views, PDF and ePub downloads, according to the available data) and Abstracts Views on Vision4Press platform.
Data correspond to usage on the plateform after 2015. The current usage metrics is available 48-96 hours after online publication and is updated daily on week days.
Initial download of the metrics may take a while.