Fig. A.1
Download original image
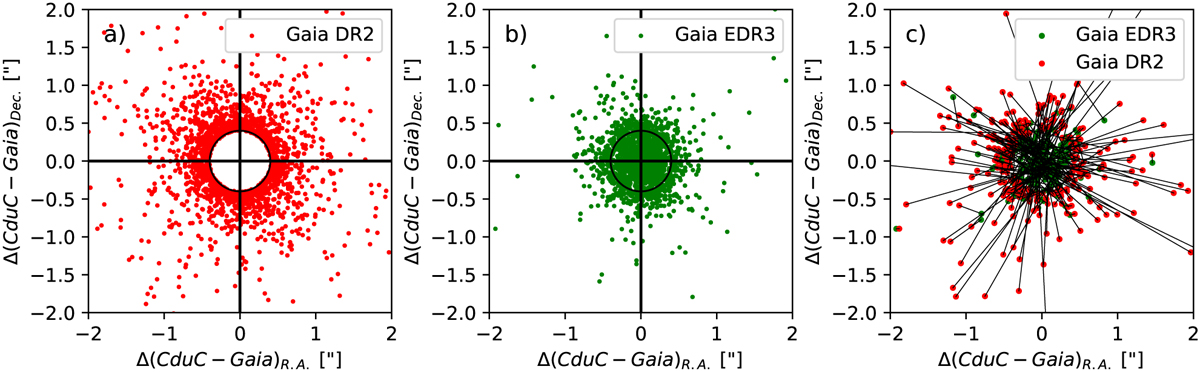
Comparison of the Δ(CduC-Gaia) coordinate differences between Gaia DR2 and EDR3. Panel a) shows the DR2-based Δ(CduC-Gaia) coordinate differences for the sources in sample S4 of the ‘correlation’ method, that is, sources for which the coordinate difference is >0.4″. The EDR3-based coordinate differences of the same stars are shown in panel b). Panel c) shows the DR2- and EDR3-based coordinate differences together, with a line connecting the two coordinate difference of each source. The sample shown in panel c) is a sub-sample of 300 sources out of the sources in panels a) and b). The circle in panels a) and b) has a radius of 0.4″.
Current usage metrics show cumulative count of Article Views (full-text article views including HTML views, PDF and ePub downloads, according to the available data) and Abstracts Views on Vision4Press platform.
Data correspond to usage on the plateform after 2015. The current usage metrics is available 48-96 hours after online publication and is updated daily on week days.
Initial download of the metrics may take a while.