Fig. 17
Download original image
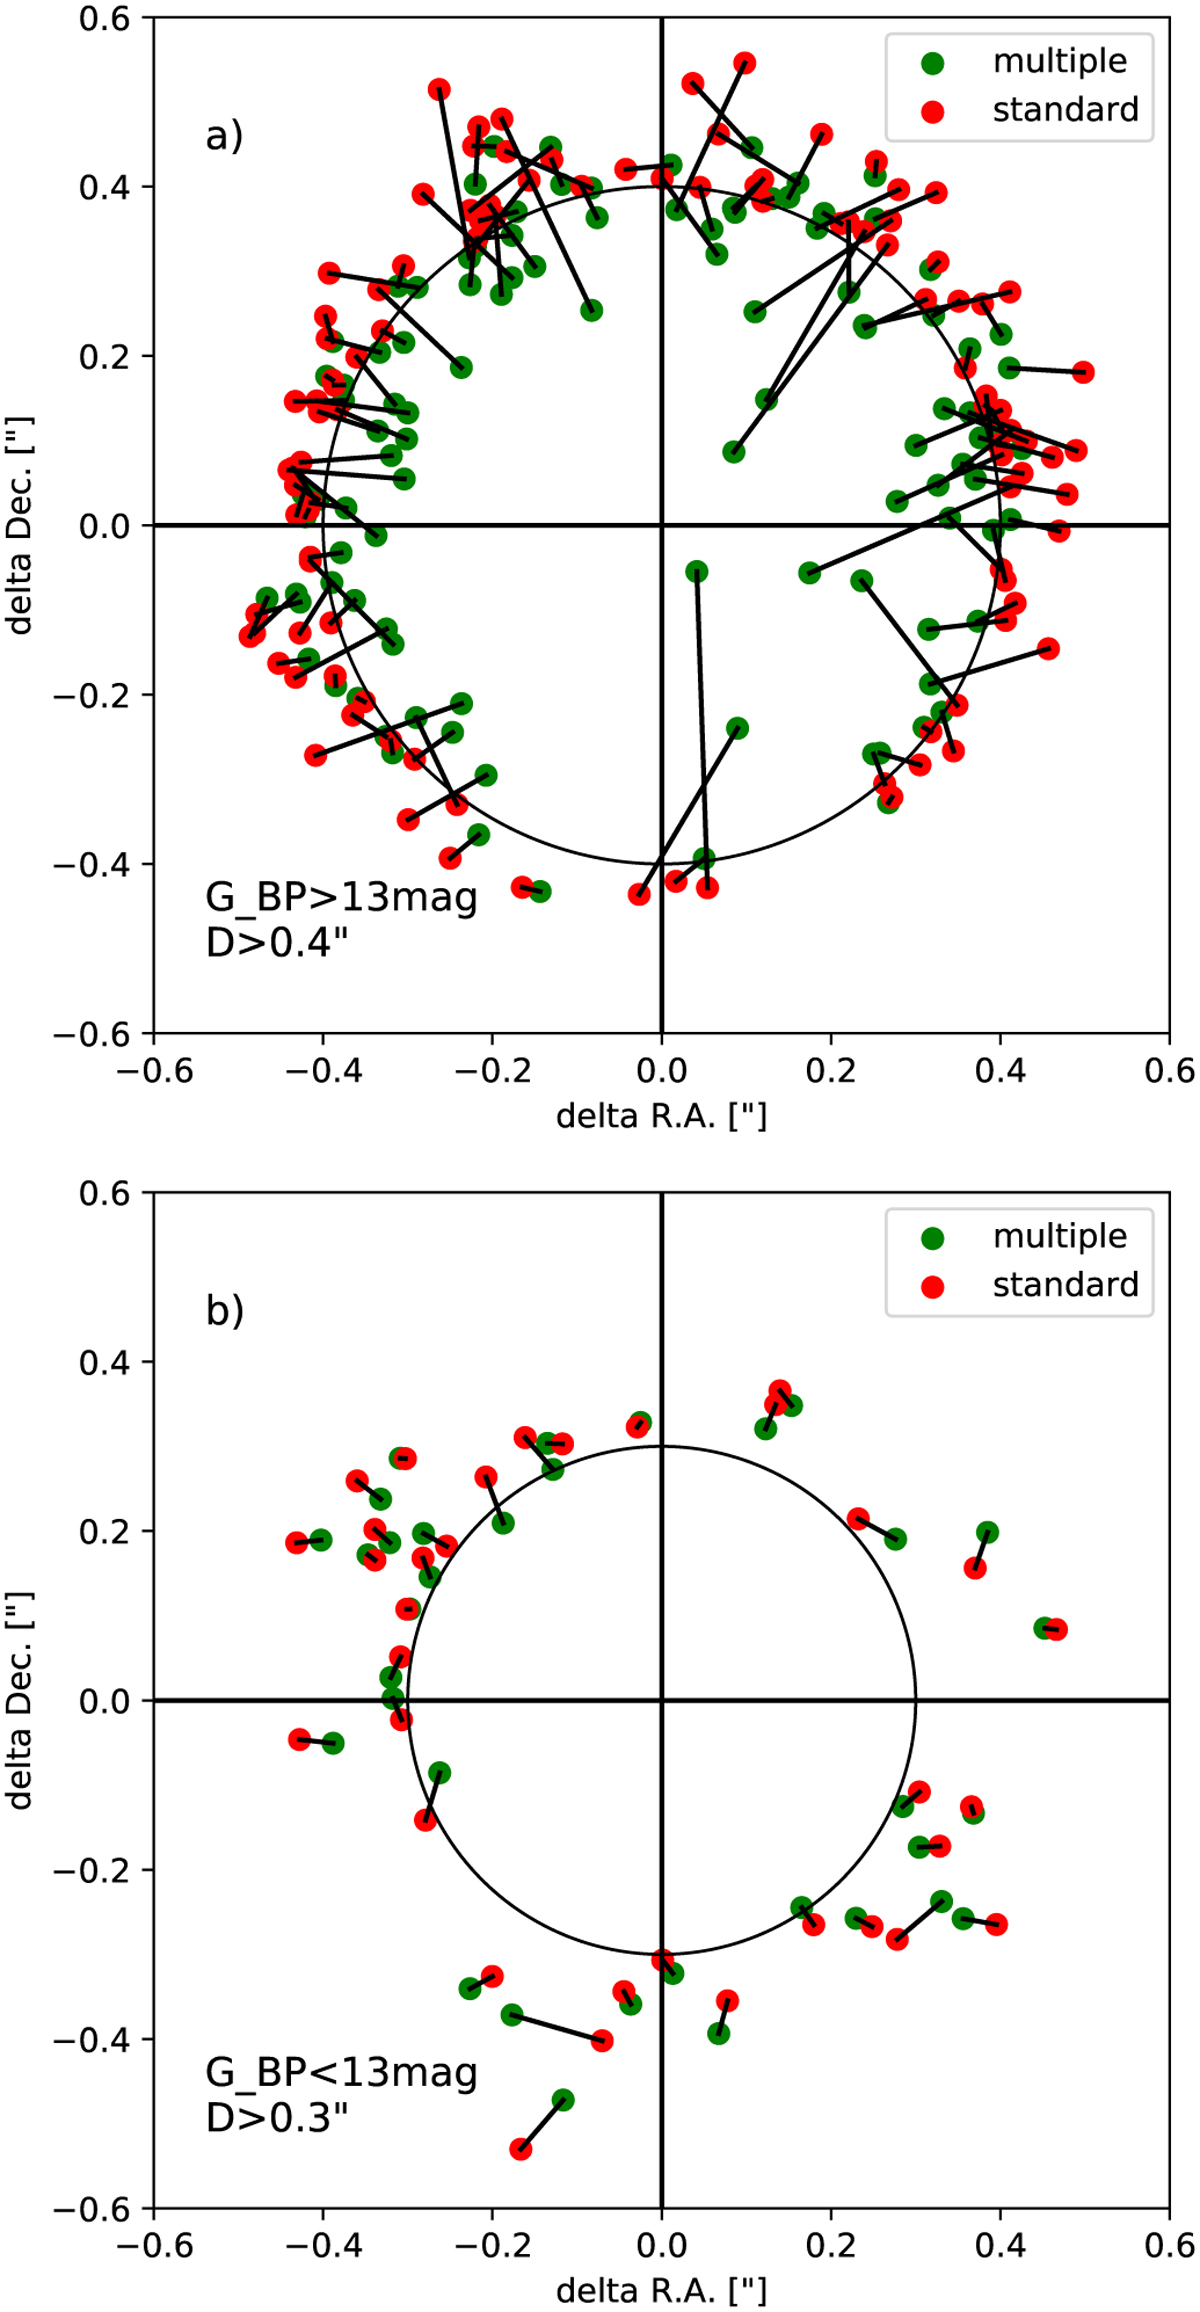
Δ(CduC-Gaia) coordinate differences for standard and multiple imaging data for the single-exposure plate #886. In multiple imaging, the coordinates are mean values of coordinates derived over several images and astrometric fits. The red and green dots are for standard and multiple imaging, respectively. The lines connect the data points of each star. The data shown in panel a) is for stars that have the Δ(CduC-Gaia) coordinate difference in standard imaging greater than 0.4″ and that have a magnitude GBP > 13 mag. The circle has a radius of 0.4″. The data shown in panel b) is for stars that have the Δ(CduC-Gaia) coordinate difference in standard imaging greater than 0.3″ and that have a magnitude GBP < 13 mag. The circle has a radius of 0.3″.
Current usage metrics show cumulative count of Article Views (full-text article views including HTML views, PDF and ePub downloads, according to the available data) and Abstracts Views on Vision4Press platform.
Data correspond to usage on the plateform after 2015. The current usage metrics is available 48-96 hours after online publication and is updated daily on week days.
Initial download of the metrics may take a while.