Fig. 15
Download original image
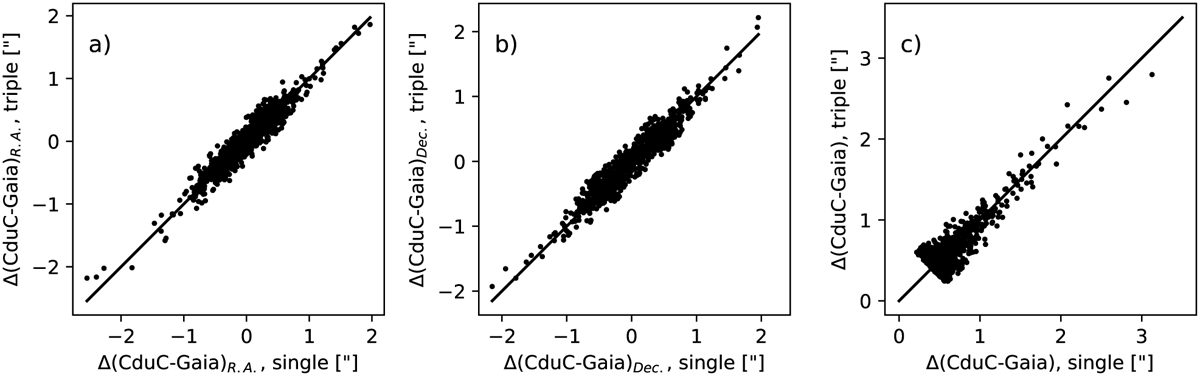
Correlations of the Δ(CduC-Gaia) coordinate differences between single- and triple-exposure plates for non-single-star candidates. The candidates are the EDR3-based sources in the ‘correlation’ S4 sample, that is, sources for which the Δ(CduC-Gaia) coordinate difference is >0.4″ (Sect. 3.3). Panels a, b, and c show the correlations for RA coordinate difference, Dec coordinate difference, and total coordinate difference, respectively. The straight lines show a one-to-one correlation.
Current usage metrics show cumulative count of Article Views (full-text article views including HTML views, PDF and ePub downloads, according to the available data) and Abstracts Views on Vision4Press platform.
Data correspond to usage on the plateform after 2015. The current usage metrics is available 48-96 hours after online publication and is updated daily on week days.
Initial download of the metrics may take a while.