Fig. 11
Download original image
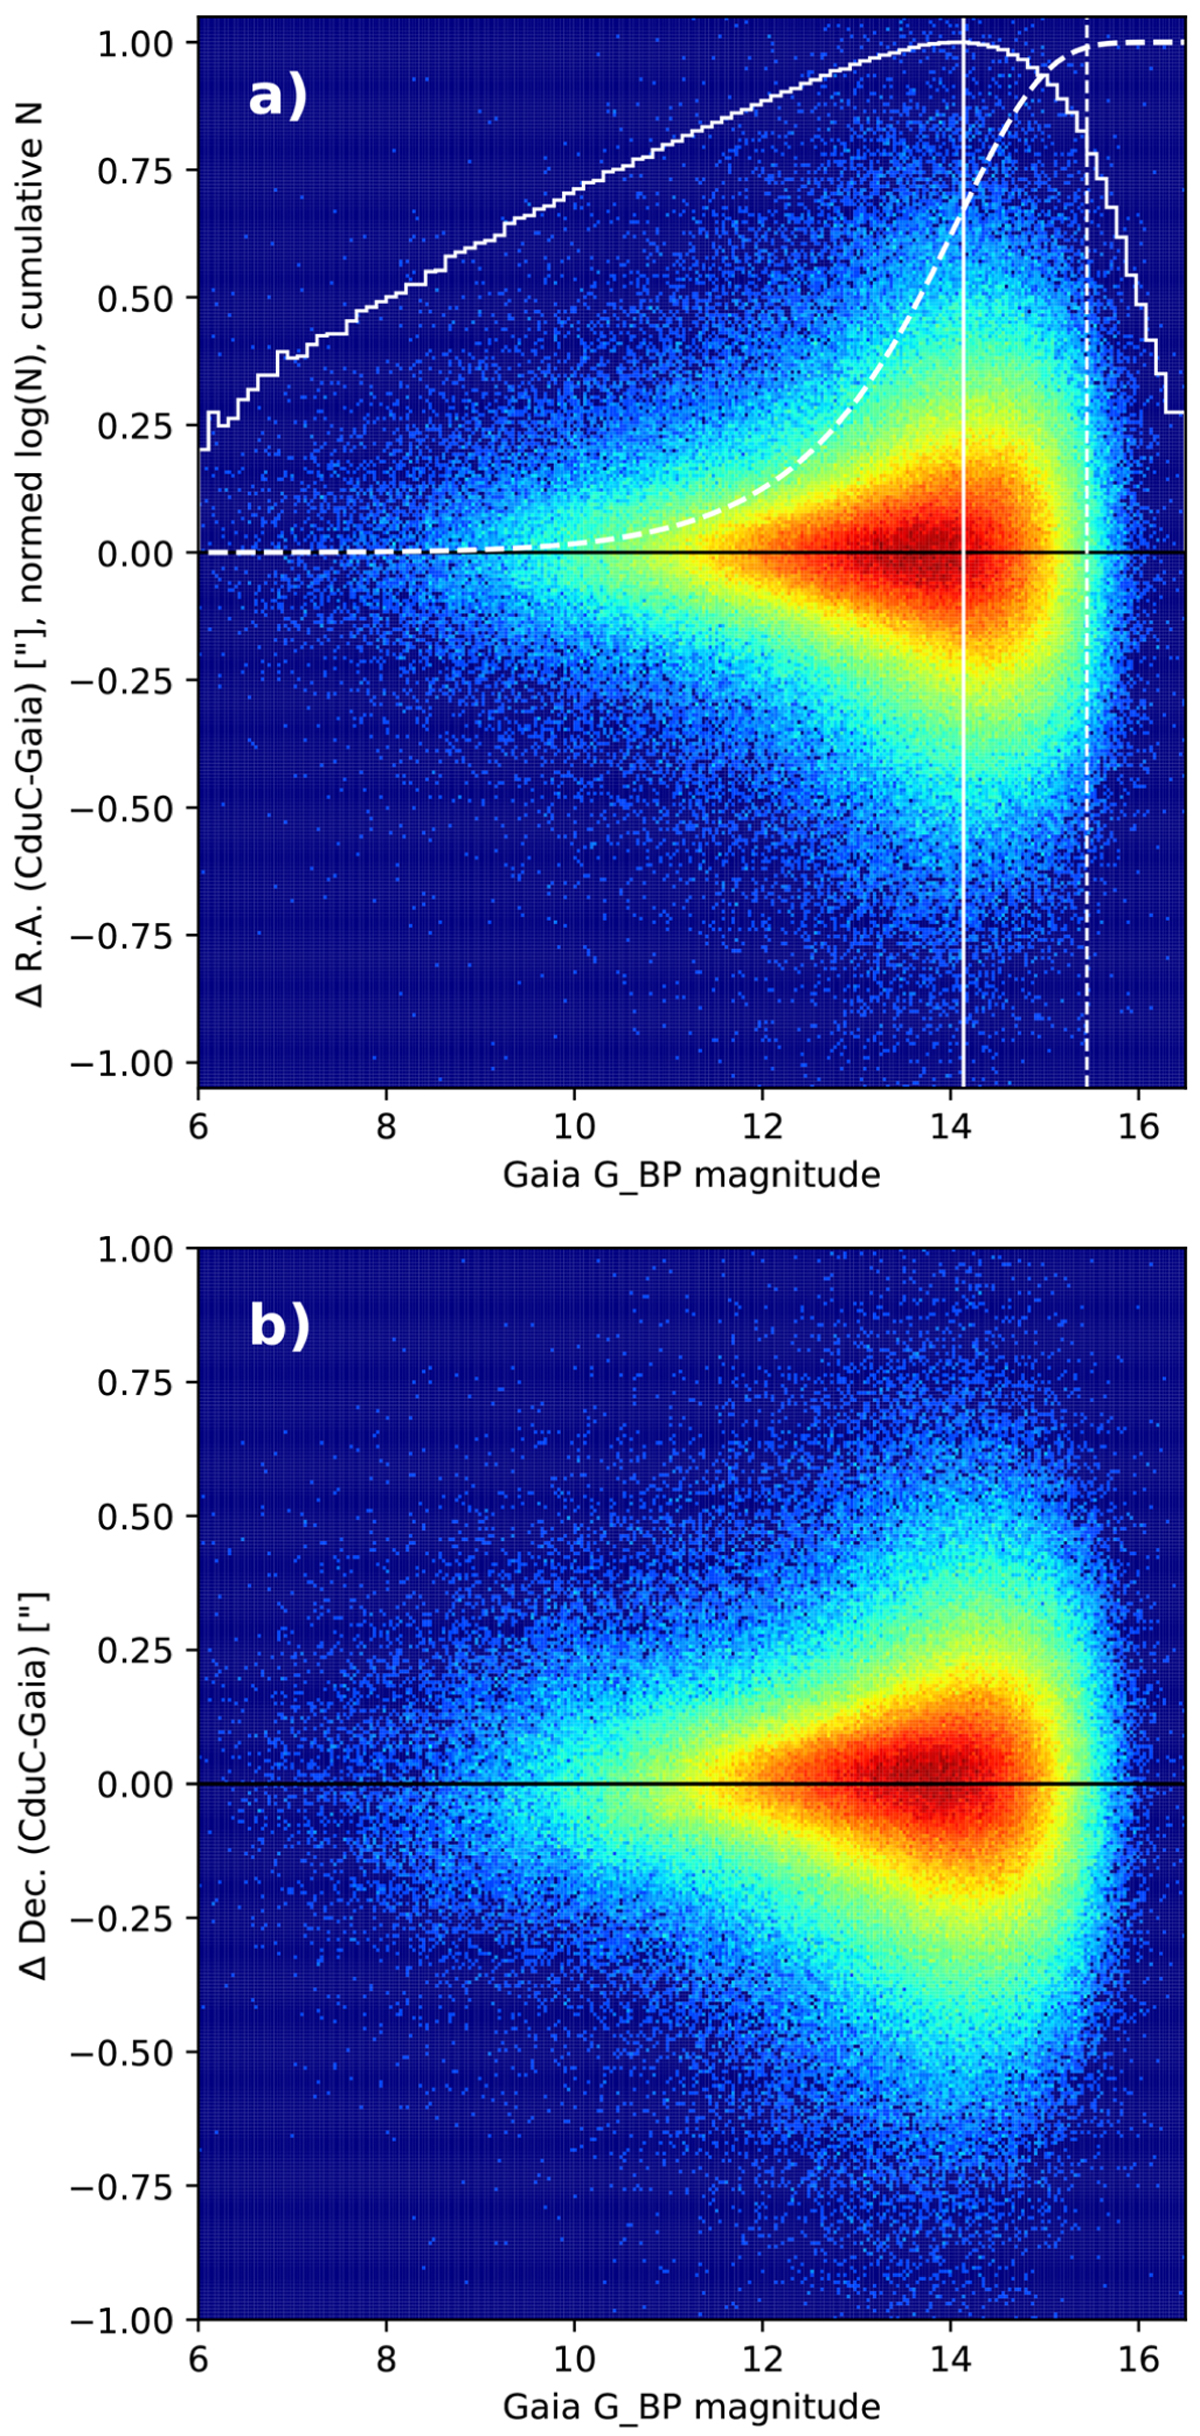
Coordinate differences between CduC and Gaia EDR3 as a function of Gaia GBP magnitude, for the single-exposure plates. Panel a) is for RA and panel b) is for Dec. The normed histogram of the logarithm of the number of stars within the magnitude bins is shown as a solid white curve, and the completeness magnitude limit of the CduC survey is shown as a vertical solid white line. The normed cumulative number of stars is shown as a dashed white line, and the 99% magnitude limit is shown as a vertical dashed white line.
Current usage metrics show cumulative count of Article Views (full-text article views including HTML views, PDF and ePub downloads, according to the available data) and Abstracts Views on Vision4Press platform.
Data correspond to usage on the plateform after 2015. The current usage metrics is available 48-96 hours after online publication and is updated daily on week days.
Initial download of the metrics may take a while.