Fig. 2
Download original image
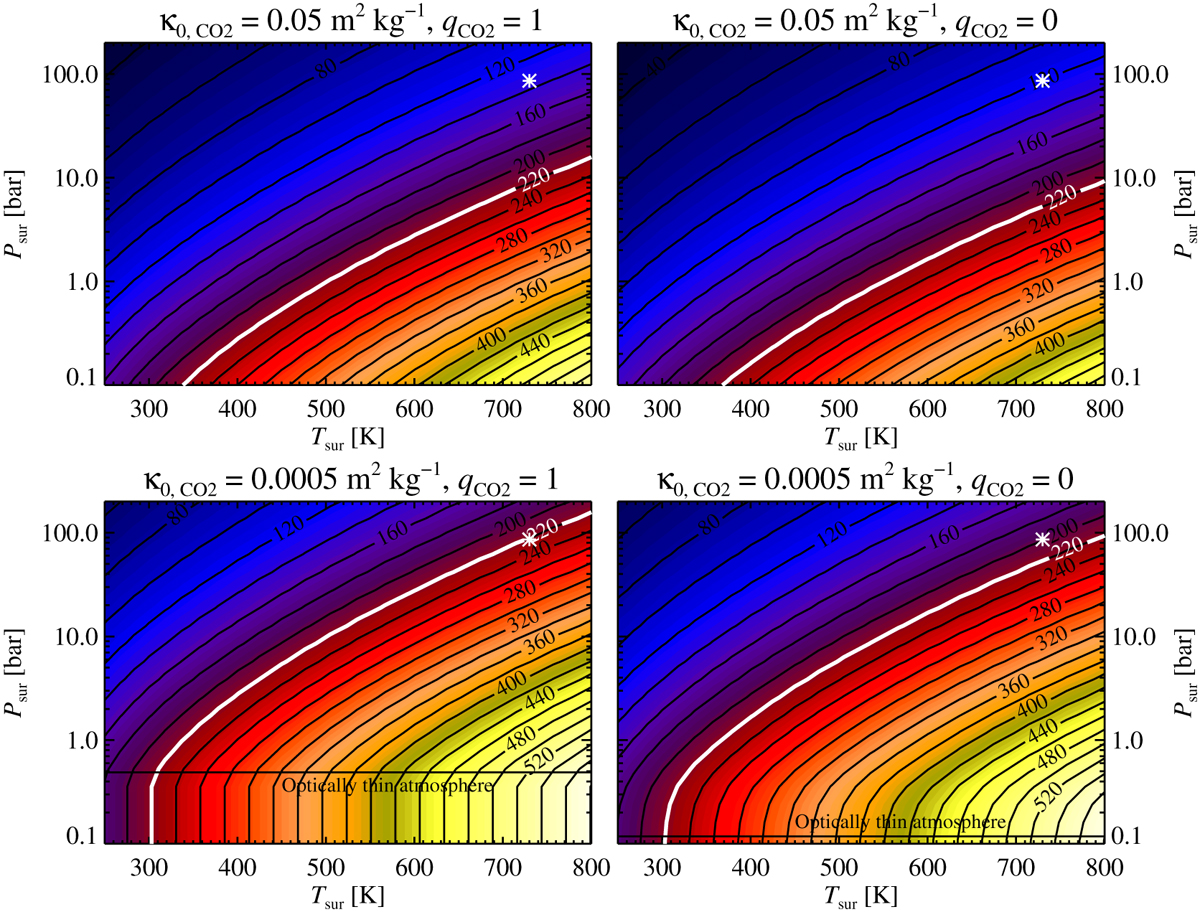
Photospheric temperature of a Venus analogue (in terms of mass and radius), for a range of surface temperatures (x-axis) and surface pressure (y-axis). The atmospheric composition is assumed to be 100% CO2. The top plots utilize a high CO2 opacity, while the bottom plots are calculated using our nominal value that is 100 times lower (see discussion in Elkins-Tanton 2008). The left plots use the nominal linear dependence of the opacity on the pressure, while the right plots show the difference when using a pressure-independent opacity instead. Our atmosphere model becomes invalid below the horizontal black line, which indicates the transition to an optically thin atmosphere. The effective temperature of Venus (220 K, when taking into accounts its relatively high current opacity) is indicated with a thick line and the temperature and surface CO2 pressure with an asterisk. We choose therefore the low opacity value and linear pressure dependence to best reproduce the atmosphere of Venus in our calculations.
Current usage metrics show cumulative count of Article Views (full-text article views including HTML views, PDF and ePub downloads, according to the available data) and Abstracts Views on Vision4Press platform.
Data correspond to usage on the plateform after 2015. The current usage metrics is available 48-96 hours after online publication and is updated daily on week days.
Initial download of the metrics may take a while.