Fig. 1
Download original image
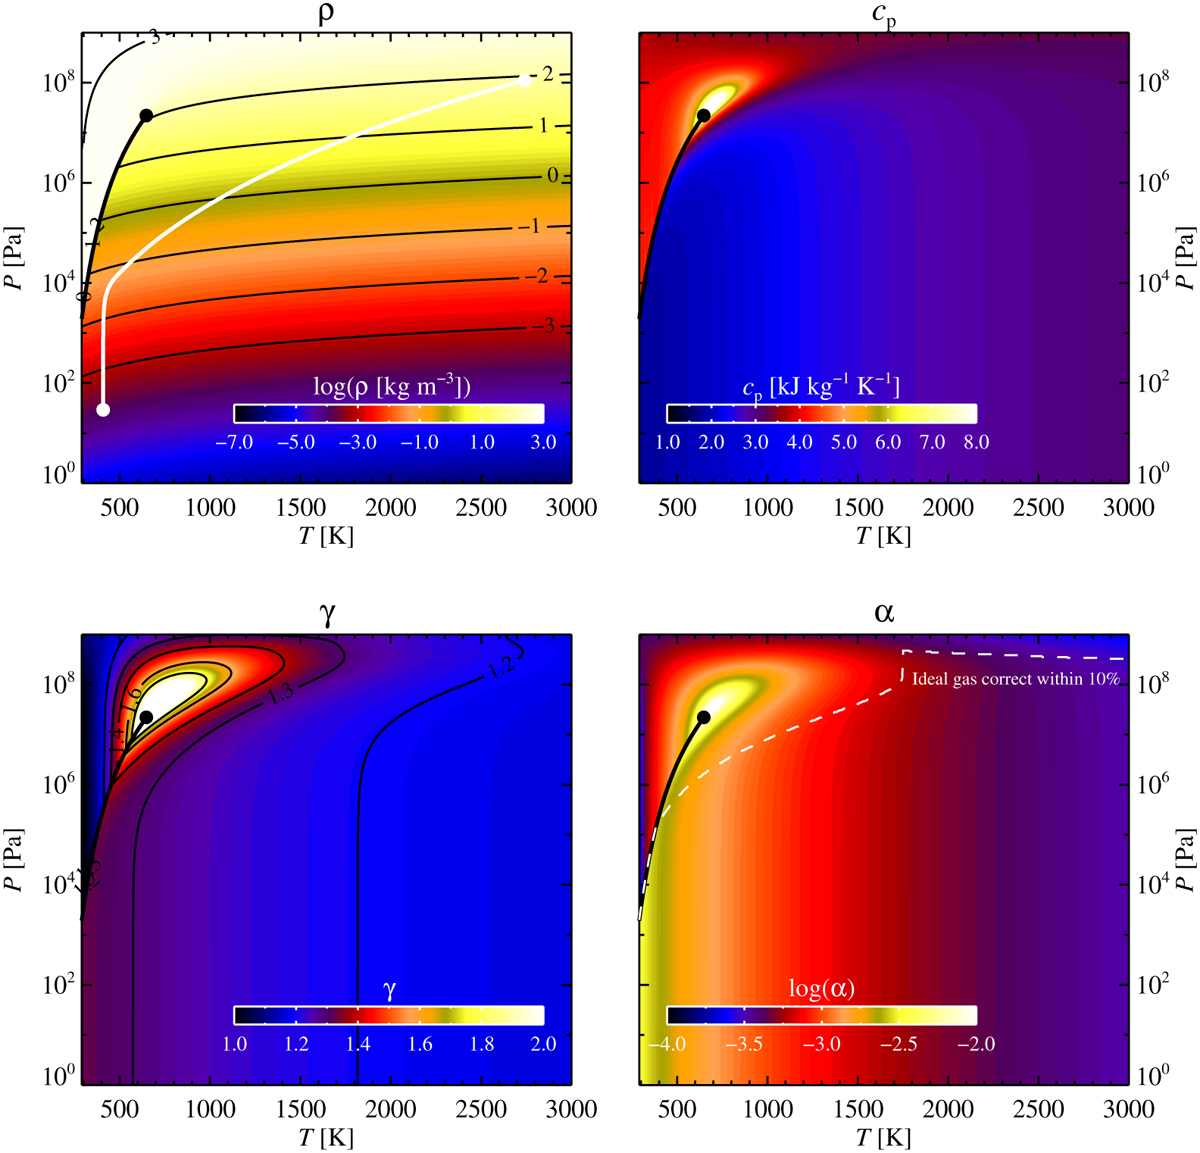
Equation of state of water based on the IAPWS prescription (http://www.iapws.org/). The top left plot shows the density of the water as a function of temperature and pressure. The thick black line indicates the saturated vapour pressure and the black dot the critical point beyond which the distinction between liquid and vapour vanishes. The white line shows the structure of the atmosphere of our Earth analogue at the beginning of the differentiation phase (t = 3.5 Myr). The top right plot shows the heat capacity at constant pressure and the bottom left the ratio of the specific heats, γ = cp/cv. Finally, the bottom right plot shows the thermal expansion coefficient α, which is needed to calculate the adiabatic lapse rate of the planetary atmosphere. For an ideal gas law, α = (1/V)(∂V/∂T)P = 1/T. The dashed line indicates where the ideal gas law expression is correct within 10% in the calculation of α.
Current usage metrics show cumulative count of Article Views (full-text article views including HTML views, PDF and ePub downloads, according to the available data) and Abstracts Views on Vision4Press platform.
Data correspond to usage on the plateform after 2015. The current usage metrics is available 48-96 hours after online publication and is updated daily on week days.
Initial download of the metrics may take a while.